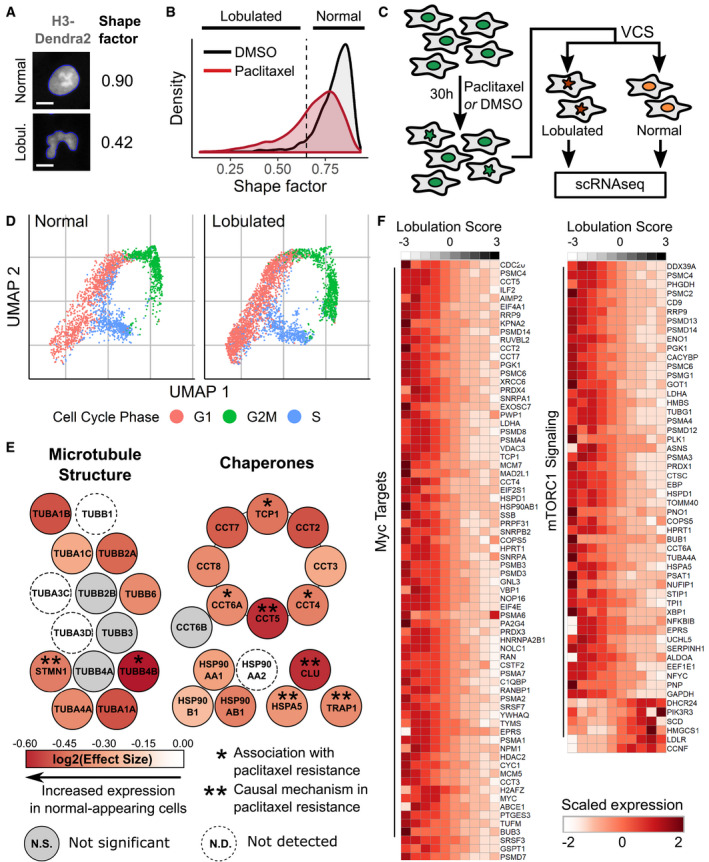
Figure 4. Visual Cell Sorting to dissect heterogeneous nuclear morphology following paclitaxel treatment.

- RPE‐1 NLS‐Dendra2 × 3 cells were treated for 24 h with 0.25 nM paclitaxel or DMSO and imaged. The shape factor, which measures the degree of an object's circularity, was computed for each nucleus. One normal nucleus with a shape factor near one and one lobulated nucleus with a low shape factor are shown. The computationally determined boundaries of each nucleus are shown in blue; scale bar = 10 μm.
- Shape factor density plots for vehicle (DMSO) and 0.25 nM paclitaxel‐treated RPE‐1 cells (n ≥ 3,914 cells per treatment). Dashed line, cutoff for lobulated nuclei (shape factor < 0.65).
- RPE‐1 cells were treated with 0.25 nM paclitaxel, then subjected to Visual Cell Sorting according to nuclear shape factor. Populations of cells with normal or lobulated nuclei were subjected separately to single‐cell RNA sequencing.
- UMAP analysis of single‐cell RNA sequencing results of paclitaxel‐treated cells. Expression of cell cycle‐related genes was used to annotate each cell as being in G1, S, or G2/M.
- A differential gene test was performed using as covariates cell cycle scores and a lobulation score, which is higher in lobulated cells compared to morphologically normal cells (Fig EV4D). Genes related to microtubule structure or various chaperone complexes are colored according to the expected log2 fold change per unit increase in lobulation score (effect size); asterisks, genes associated with paclitaxel resistance (Alli et al, 2007; Ooe et al, 2007; Di Michele et al, 2009; Su et al, 2009; Li et al, 2013; Dorman et al, 2016).
- Expression counts for genes associated with c‐Myc and mTORC1 signaling were aggregated across cells binned according to their lobulation score, then log‐normalized and rescaled. Higher lobulation scores correspond to a higher likelihood of nuclear lobulation.
