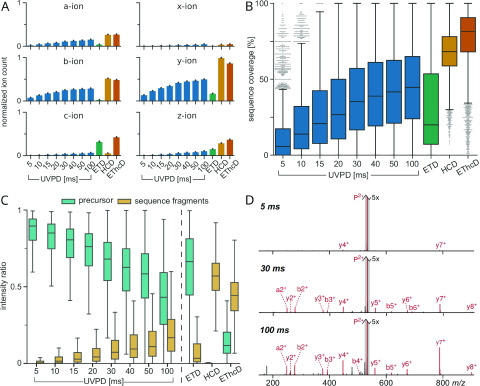
Figure 2.
Fragmentation analysis of 14 511 unique PSMs from 11 279 unique peptides subjected to different UVPD excitation times and ETD, HCD, and EThcD for comparison. Data from the E. coli data set. (A) Bar plots showing the sequence fragment ion type counts (normalized by peptide length). Error bars represent 0.95 confidence intervals. (B) Box plots showing sequence coverage of precursors. (C) Box plots of MS2 intensity ratios of remaining precursor and sequence fragments with respect to the total MS2 intensity. In all box plots, whiskers extend to the 1.5 interquartile range past the low and high quartiles. (D) Example MS2 spectra of YLDLIANDK (charge 2+) subjected to 5, 30, and 100 ms of UVPD. All three spectra are zoomed in on the y axis (5×). Annotated fragment peaks are shown in red, and the unfragmented precursor is highlighted with a gray outline.

