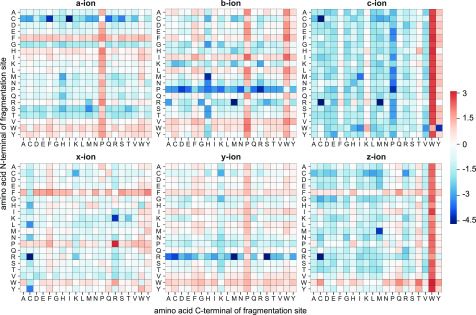
Figure 5.
Cleavage propensities of backbone fragment ion types for UVPD. Heat maps show the ratio of detected versus theoretical cleavage events for all amino acid combinations that can occur at the N- and C-terminals of the fragmentation site. Values were normalized by the mean for each ion type and then converted to the base 2 logarithm. White represents the average cleavage propensity for this ion type, blue represents a lower-than-average occurrence, and red represents a higher-than-average occurrence.

