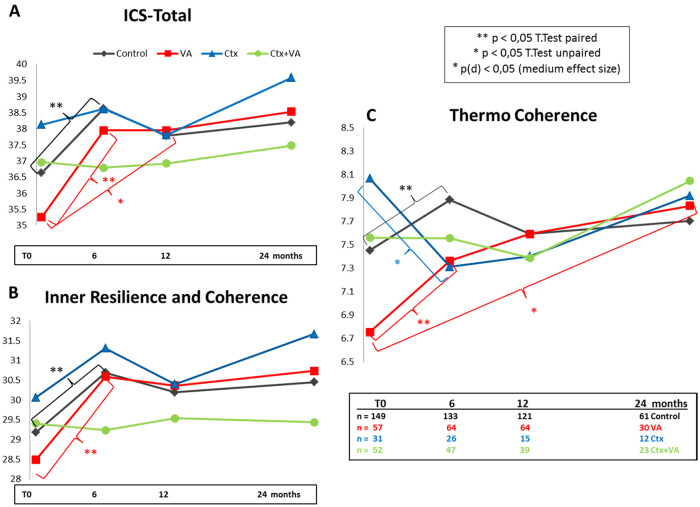
Figure 2.
Internal Coherence Scale (ICS) for the treatment groups. For the entire study cohort, the ICS questionnaires at baseline (T0) and 6, 12, and 24 months, thereafter, were analyzed. The mean values of (A) the total ICS, (B) inner resilience and coherence, and (C) thermo-coherence scores for the control (black), Viscum album L therapy (VA; red), chemotherapy (Ctx; blue), and Ctx + VA (green) groups are shown.

