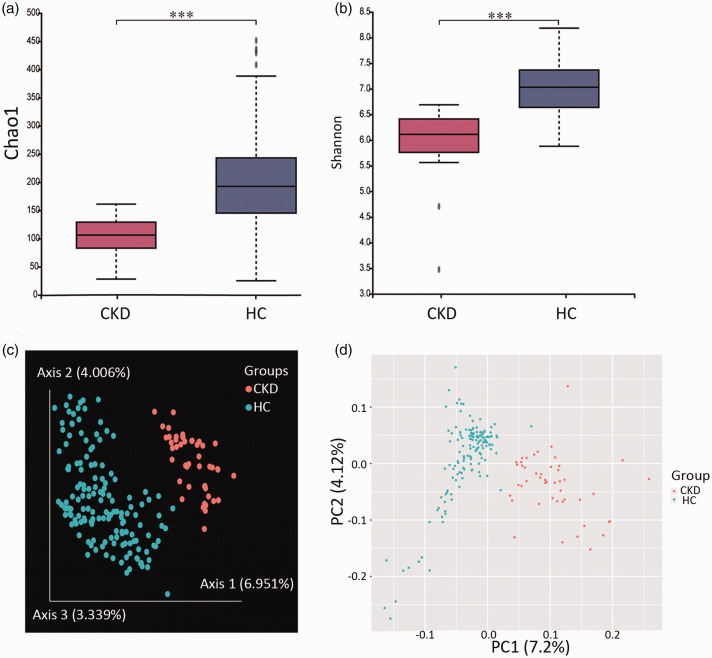
Figure 1.
Comparisons of intestinal flora diversity between chronic kidney disease patients and age- and sex-matched healthy controls. (a) Chao1 index for assessing α-diversity. (b) Shannon index for assessing α-diversity. (c) Principal coordinate analysis outcomes based on Bray–Curtis distance for β-diversity. % denotes the interpretation percentage of the principal component. (d) Principal component analysis outcomes for β-diversity. ***P<0.001, according to the Kruskal–Wallis test.

