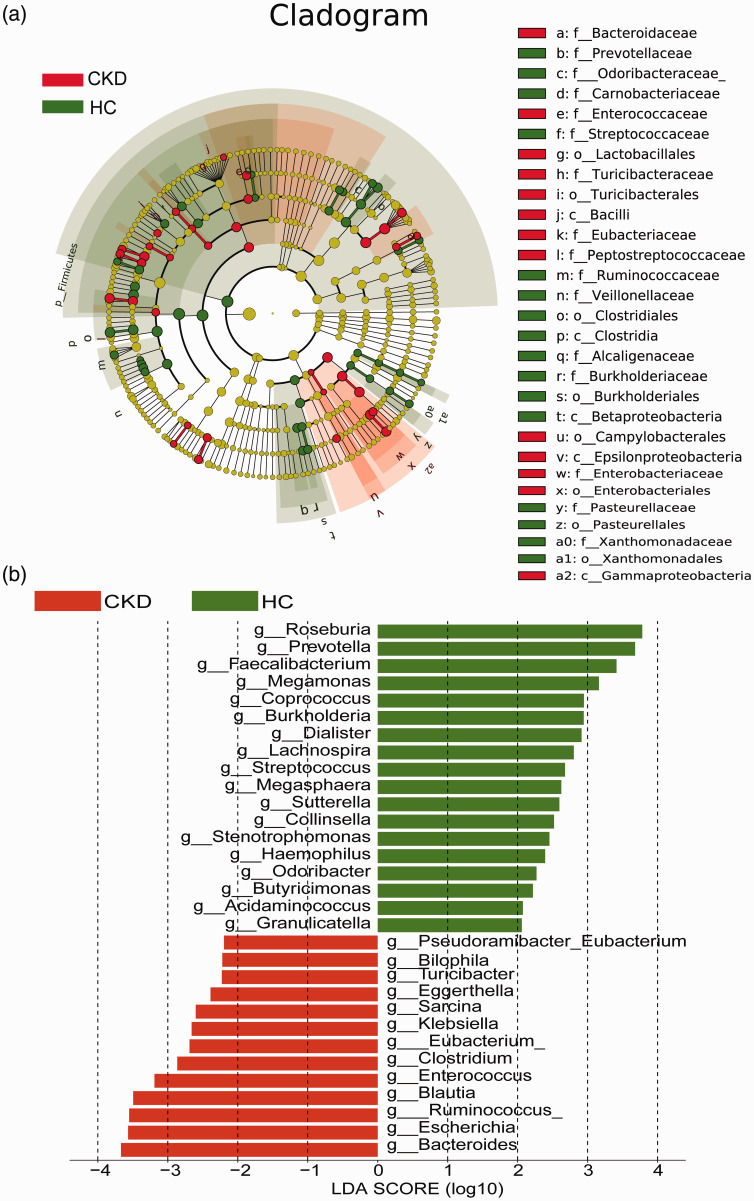
Figure 3.
Species that differed significantly between the chronic kidney disease (CKD) patients and healthy controls based on LEfSe. (a) Species with significantly different relative abundances (red dot, CKD group; green dot, healthy controls). (b) Species with significantly different abundances (red, CKD group; green, healthy controls). Only the taxonomic clusters with linear discriminant analysis >2.0 at the genus level are shown.

