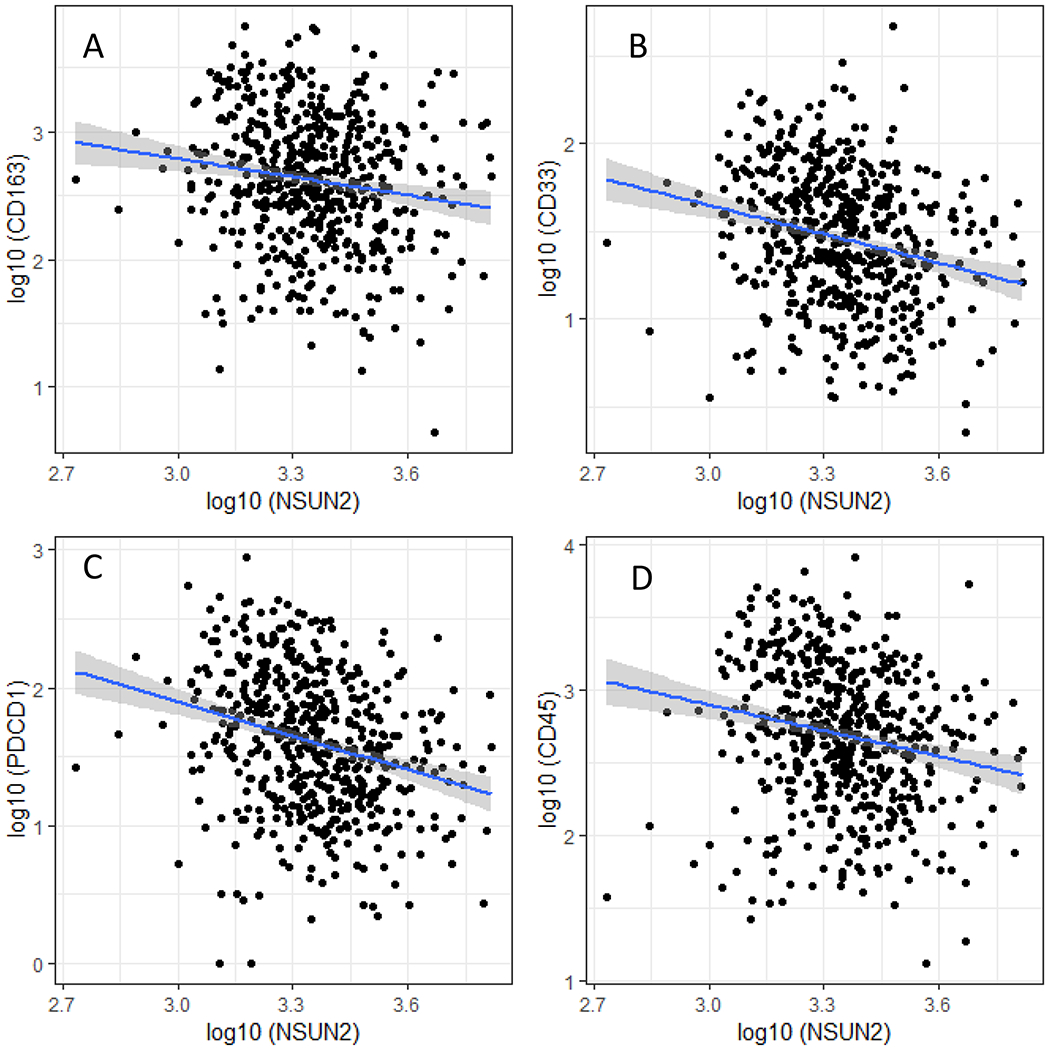
Figure 1.

Scatter plot of NSUN2 expression with the markers for macrophage and myeloid cells. Expression (log10 FPKM) of NSUN2 is plotted against A) CD163, B) CD33, C) PDCD1 and D) CD45. The linear trend line is in blue, and the grey bound represents the 95% confidence interval.
