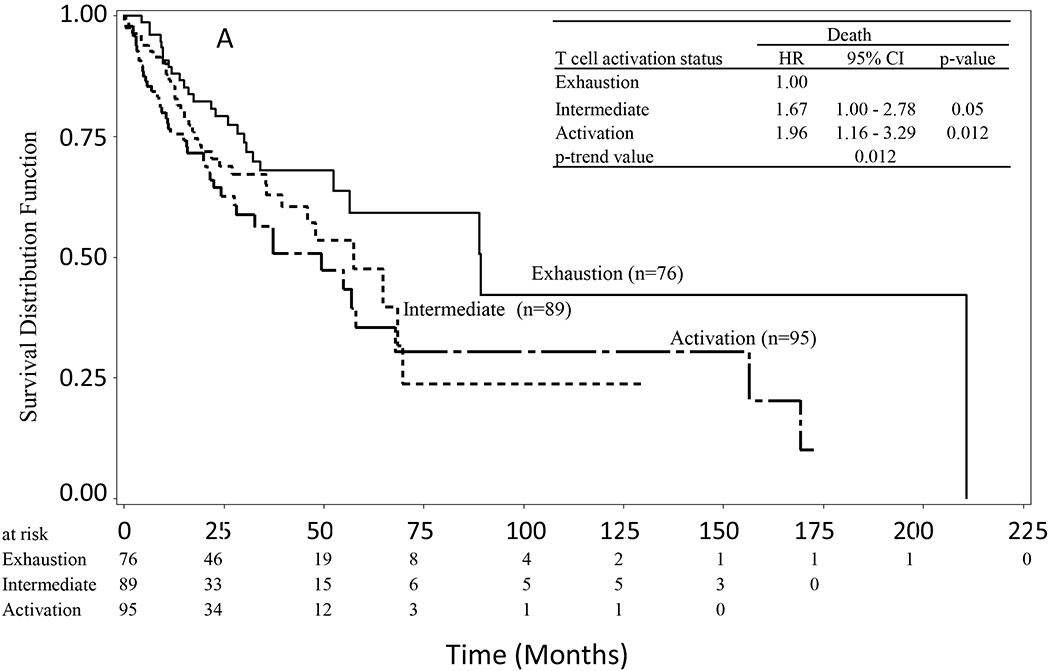
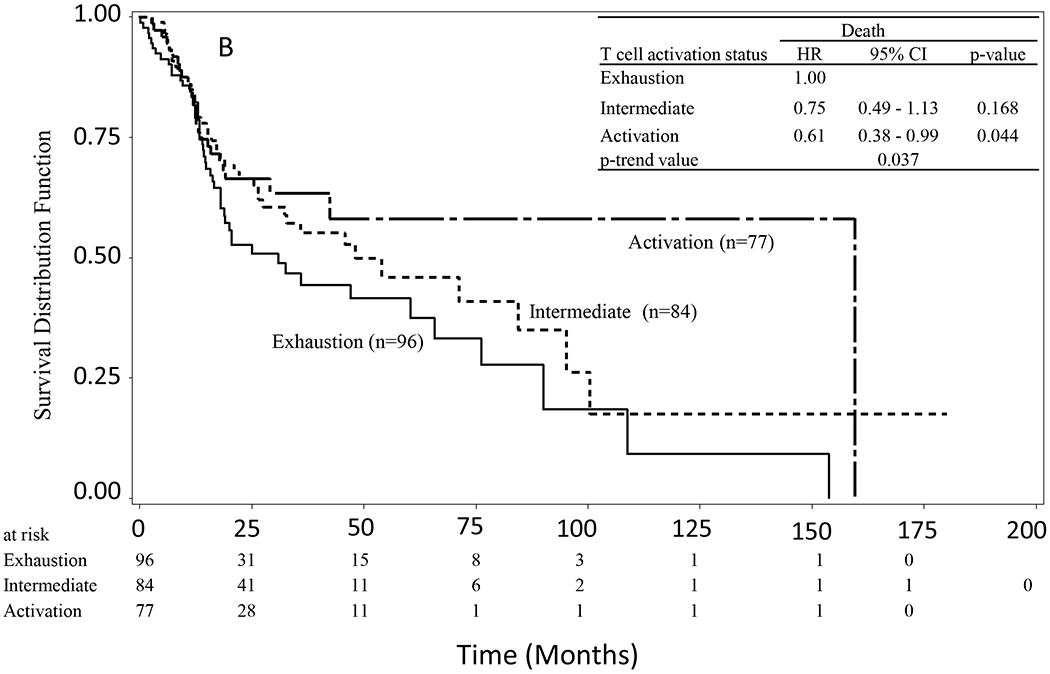
Figure 2.


Kaplan-Meier survival curves of HNSCC stratified by T-cell activation status (score). A) In the subgroup with a low expression of NSUN2, patients in the Activation group had reduced overall survival compared to those in the Exhaustion group (P = 0.012). B) In the subgroup with a high expression of NSUN2, patients in the Activation group had longer overall survival than those in the Exhaustion group (P = 0.037).
