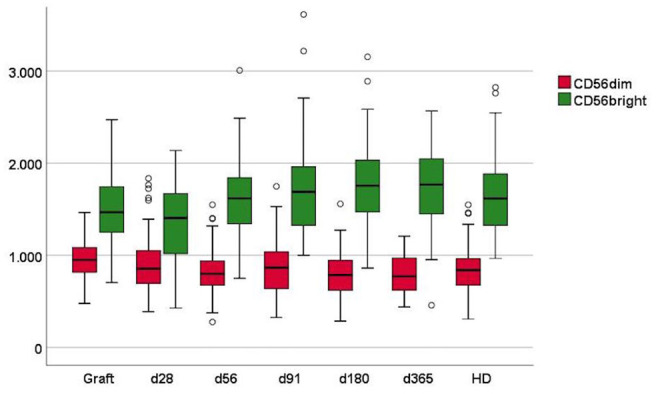
Figure 2.

Mean fluorescence intensity (MFI) of NKG2D in NK cell subsets in grafts, peripheral blood of patients day 28–365 after transplantation and in peripheral blood of healthy donors (HD). Patient numbers day 28 n = 86, day 56 n = 84, day 91 n = 79, day 180 n = 71, day 365 n = 53, grafts n = 88, HD n = 53. Whiskers represent interquartile range.
