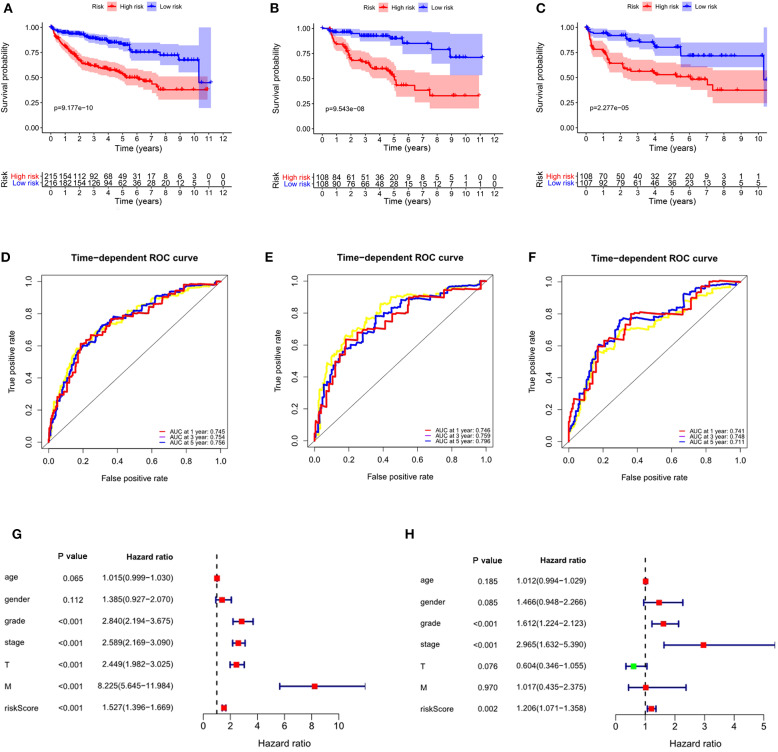
Figure 10.
The autophagy-related signature for DFS is an independent prognostic factor for ccRCC. (A) Kaplan-Meier DFS curves for the high- and low-risk groups in the entire data set; (B) Kaplan-Meier DFS curves for the high- and low-risk groups in the training set; (C) Kaplan-Meier DFS curves for the high- and low-risk groups in the validation set; (D) ROC curves in the entire data set; (E) ROC curves in the training set; (F) ROC curves in the validation set; (G) Univariate Cox regression analysis of correlations between the risk score for DFS and clinical variables. (H) Multivariate Cox regression analysis of correlations between the risk score for DFS and clinical variables.

