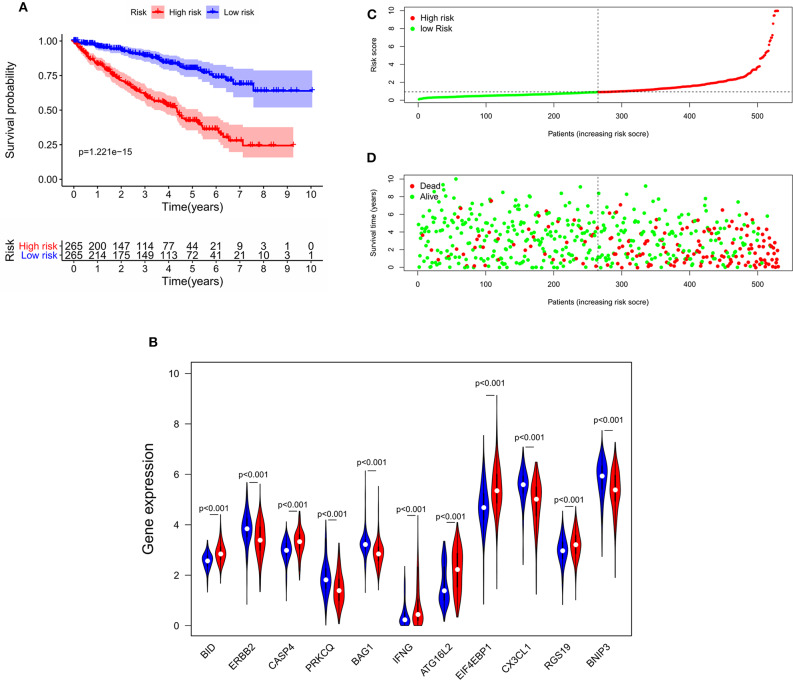
Figure 5.
The correlation between the eleven-gene autophagy-related signature for OS and the prognosis of patients with ccRCC. (A) Kaplan-Meier OS curves for the high- and low-risk groups. (B) Expression of eleven autophagy-related genes in the high- and low-risk groups. Red represents the high-risk group, and blue represents the low-risk group. (C) Distribution of the risk scores of ccRCC patients. (D) The number of survivors and non-survivors with different risk scores; red represents the number of non-survivors, and green represents the number of survivors. OS, overall survival; ccRCC, clear cell renal cell carcinoma.

