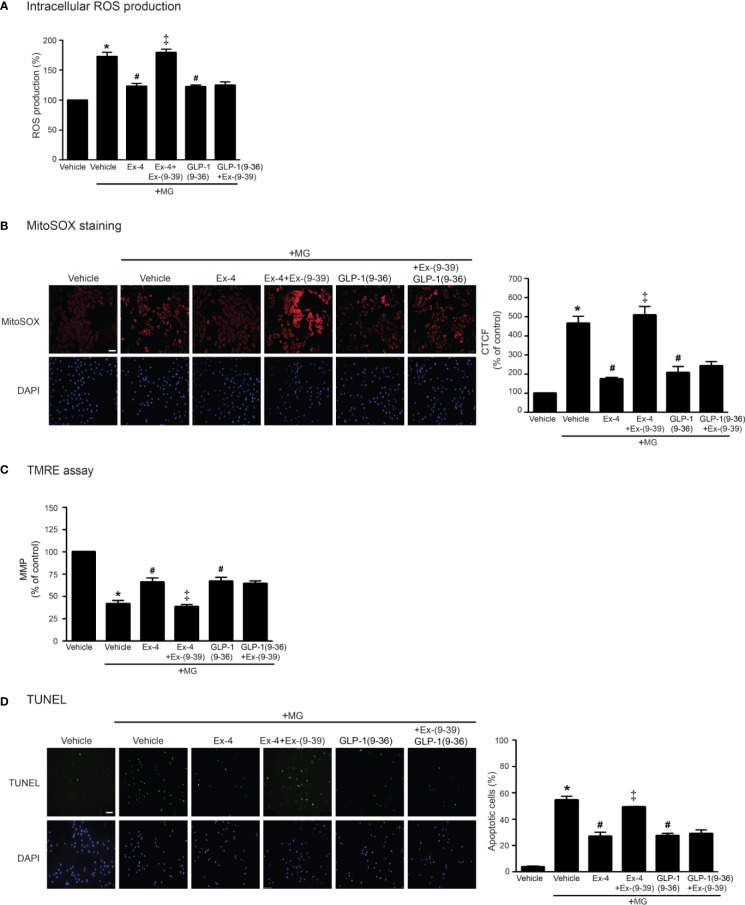
Figure 6.
Treatment with either exendin-4 or GLP-1(9–36) prevents MG-induced oxidative stress, apoptosis, and mitochondrial dysfunction in H9c2 cells. (A–D) H9c2 cells were pretreated without or with 100 nM Ex-(9–39) (GLP-1R antagonist) for 1 h before treatment with either vehicle (control), exendin-4 (Ex-4) or GLP-1(9–36) (a native GLP-1 metabolite) for 3 h. Cells were then incubated with methylglyoxal (MG) for the indicated time. The intracellular ROS production was quantified and expressed as the percentage relative to vehicle group (control). (B) The mitochondrial ROS level was detected by staining with MitoSOX (red), and DAPI (blue) to show nuclei. The fluorescence values were quantified using the corrected total cell fluorescence (CTCF) and expressed as the percentage of control. Scale bar, 10 μm. (C) The relative mitochondrial membrane potential (MMP) levels were evaluated and represented as the percentage of control. (D) Apoptotic cells were assayed by TUNEL staining (green) and counterstained with DAPI (blue) to show nuclei. The number of apoptotic cells was determined by the percentage of control, Scale bar, 10 μm. Data are presented as means ± SEM (N = 4). *P < 0.05 vs. vehicle; #P < 0.05 vs. MG; ‡P < 0.05 vs. MG+Ex-4.

