FIGURE 2.

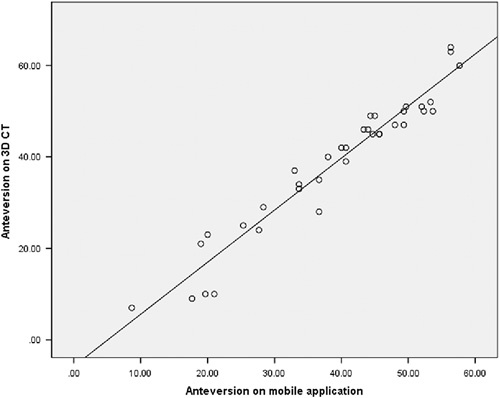
Scatter plot illustrating the relationship between femoral anteversion as measured on 3D computed tomographic (CT) images and that measured using the reconstructed images from the mobile application.

Scatter plot illustrating the relationship between femoral anteversion as measured on 3D computed tomographic (CT) images and that measured using the reconstructed images from the mobile application.