
FIGURE 2.
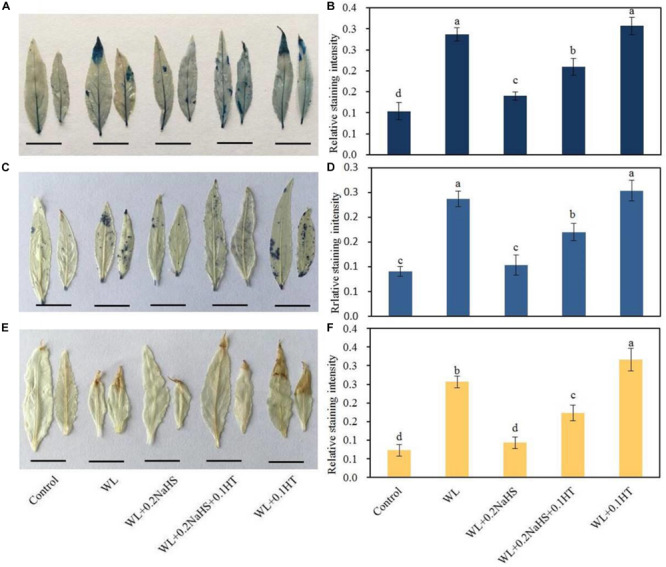
Effects of exogenous H2S on cell death and ROS accumulation of peach seedlings leaves under waterlogging conditions. (A) Staining with Evans Blue to show areas of cell death; (B) Evans Blue staining intensity as determined with ImageJ software. (C) Distribution of superoxide anion radicals (O2–) visualized by nitroblue tetrazolium (NBT), and (D) NBT staining intensity as determined with ImageJ software. (E) hydrogen peroxide (H2O2) was visualized by 3,3-diaminobenzidine (DAB) staining in peach leaves. (F) DAB staining intensity as determined with ImageJ software. In (B; D; F) each data point represents the mean (with SD bar) of three replicates. Values followed by different letters in the same day are significantly different at P < 0.05.