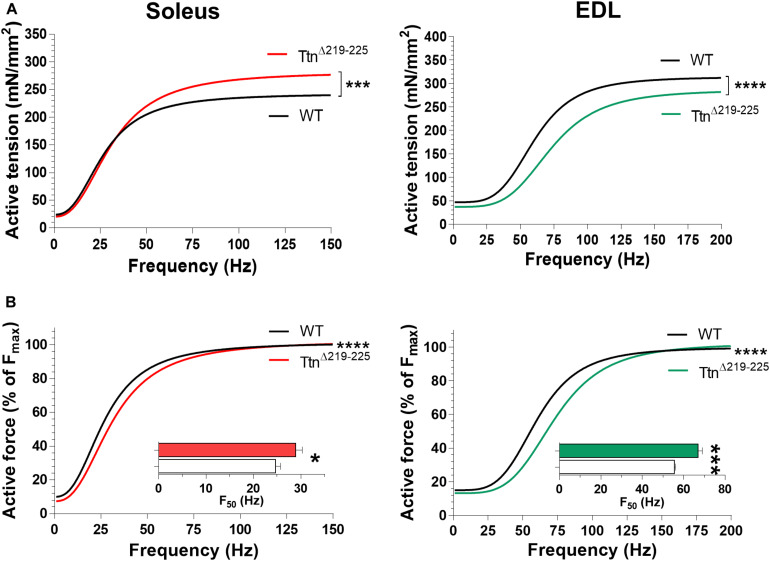
FIGURE 4.
Muscle contractility of TtnΔ219–225 mice. (A) curve fit of the active tension-stimulation frequency relation for soleus (left; WT, black line; TtnΔ219–225 red line) and EDL (right; WT, black line; TtnΔ219–225 green line), respectively, (N = 6–7, males; soleus maximal stimulation frequency: 150 Hz, and EDL: 200 Hz). (B) Curve fit in which active force is expressed as a % of maximum force for soleus (left) and EDL (right); insert depicts the frequency that produces 50% of the maximum active tension (F50). Curve fit; ***p < 0.001, ****p < 0.0001 and inserts t-test; *p < 0.05, ***p < 0.001.

