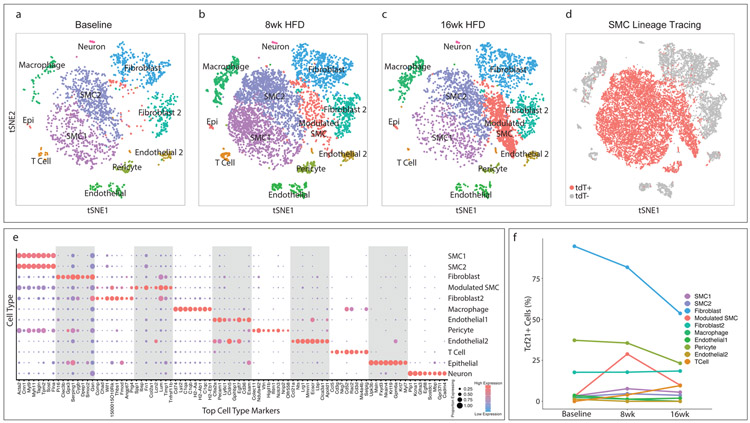
Figure 1. Transcriptomic characterization of mouse aortic root atherosclerotic plaques and Tcf21 expression.
(a–c) t-Stochastic Neighbor Embedding (t-SNE) visualization of cell types present in the mouse aortic root at (a) baseline, n=3 mice, (b) after 8 weeks of high-fat diet (HFD), n = 3 mice and (c) 16 weeks of HFD, n= 3 mice , illustrating the appearance of a disease-specific cell type, the “modulated SMC” cluster. All cell cluster identities are indicated in a-c. (d) SMC lineage traced cells, identified by their expression of the tdT reporter gene via FACS, are labeled in red for all timepoints. tdT+, cells expressing tdT; tdt−, cells not expressing tdT. (e) The top 8 genes defining each type of cell cluster in (a–c) are listed. The size of each circle represents the fraction of cells in each cluster that express at least 1 detected transcript of each gene; the color scale indicates expression level (blue = low, red = high). (f) Percentage of cells of each cell type that contained detectable (non-zero) Tcf21 levels at baseline, 8 weeks and 16 weeks of disease. Epi = epithelial-like cell.

