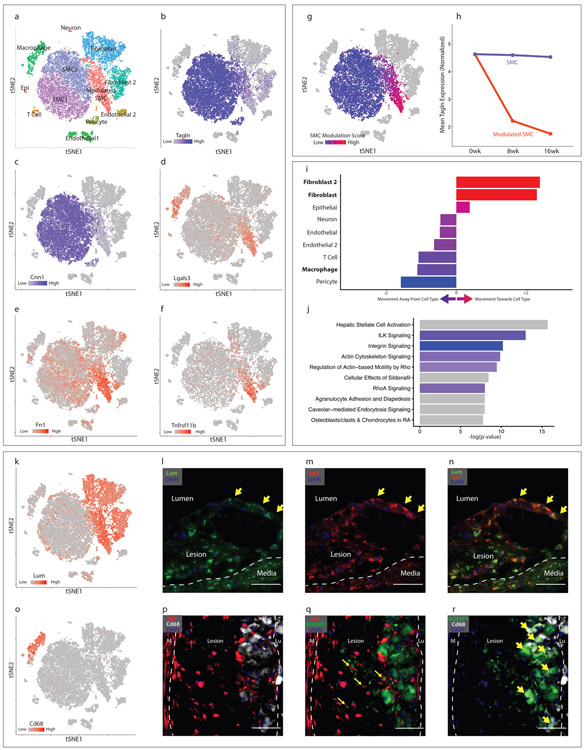
Figure 2. Characterization of SMC phenotypic modulation in the mouse aortic root.
(a-g) t-SNE visualization of cell types present in the wild-type mouse aortic root from all timepoints combined (n=9 mice). (a) Cell types are indicated for each cluster. (b–f) t-SNE visualization at all timepoints combined, overlaid with expression of Tagln, Cnn1, Lgals3, Fn1 and Tnfrsf11b. Expression levels are indicated by scales in the lower left of each panel. n=9 mice. (g) A SMC modulation score was calculated for each cell based upon the expression of top differentially expressed genes between modulated SMC and contractile SMC clusters. Blue indicates more similarity to contractile SMC, red indicates more similarity to phenotypically modulated SMC. (h) Tagln expression in quiescent and modulated SMCs at 0, 8 and 16 weeks of high-fat diet (HFD). All expression levels are normalized for library size and log-transformed. (i) Transcriptional shift from contractile SMC to phenotypically modulated SMC phenotype at 16 weeks HFD, from the viewpoint of each non-SMC cell type within the lesion. Bars to the right of center indicate that, relative to contractile SMCs, modulated SMCs have shifted toward a given cell type. Bars to the left indicate that they have shifted away. Color represents the magnitude of shift (blue = farther away, red = closer towards). (j) Top enriched pathways for gene expression changes seen with SMC phenotypic modulation, as performed with Ingenuity Pathway Analysis (IPA). The top 200 differentially-expressed genes were analyzed with Fisher’s exact test (right-sided). Blue bars indicate negative Z-scores of predicted activation, and grey bars indicate that the pathway had not yet been annotated by IPA to yield an activity pattern. (k) t-SNE visualization at all timepoints combined, overlaid with expression of Lum. n=9 mice. (l-n) RNAscope staining in the mouse aortic root at 8 weeks of high-fat diet. Yellow arrows highlight cells at the fibrous cap expressing both Lum (green, in l) and tdT (red, in m), with merged Lum and tdT staining shown in (n). Dapi staining is shown in blue. Images in (l-n) are representative of 3 experiments, and scale bars represent 50μm. (o) t-SNE visualization at all timepoints combined, overlaid with expression of Cd68. n=9 mice. (p) tdT expression (red) and Cd68 immunostaining (white). Dapi staining is shown in blue. (q) tdT expression (red) and BODIPY lipid stain (green). Co-localization of tdT and BODIPY is highlighted with yellow arrows. (r) BODIPY lipid stain (green) and Cd68 immunostaining (white). Co-localization of BODIPY and Cd68 is highlighted with yellow arrows. Lu = lumen, M = media. Images in (p-r) are representative of 3 experiments, and scale bars represent 50μm.

