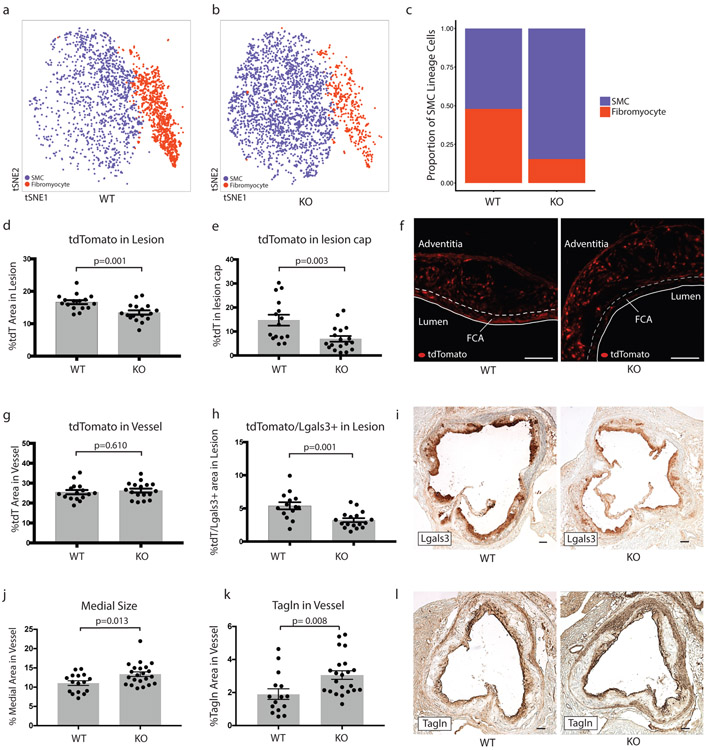
Figure 3. SMC-specific Tcf21 knockout markedly inhibits SMC phenotypic modulation in mice.
(a,b) Prevalence of contractile SMCs (blue) and fibromyocytes (red) at 16 weeks of disease in (a) SMClin (n=3 mice) and (b) SMClin-KO (n=3 mice). (c) Proportions of contractile (blue) and modulated (red) SMCs after 16 weeks of disease in SMClin and SMClin-KO mice (n=3 mice for each genotype, chi-square p = 2.2e−16). (d,e) Percentage of tdT-positive staining area in the lesion (d) and in the fibrous cap (e) defined as the area of the lesion within 30 μm of the luminal surface). (f) Representative images of tdT positive cells in SMClin and SMClin-KO mice. FCA = fibrous cap area. (g) Total tdT content of the vessel. (h) tdT+/Lgals3+ area in the lesion. (i) Representative images of Lgals3+ staining in the lesions of SMClin and SMClin-KO mice. Medial size (j) and Tagln content (k) in SMClin and SMClin-KO mice. Representative images of Tagln staining are shown in (l). All data in (d-l) were at 16 weeks of disease. Scale bars in (f,i and l) represent 100μm. Data in (d,e,g,h,j,k) were analyzed using a two-sided Student’s t-test. Error bars denote standard error.

