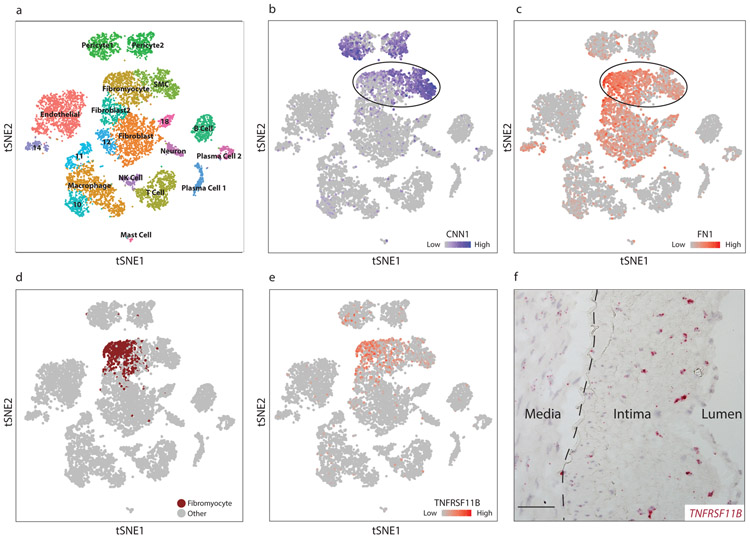
Figure 4. Identification of modulated SMCs in diseased human coronary arteries.
(a) t-SNE visualization of cell types isolated from the right coronary artery of four human patients, with assigned cell cluster identities indicated. (b-c) t-SNE visualization overlaid with expression of CNN1 (b) and FN1 (c). Expression levels are indicated by scales in the lower right of each panel. Data from n=4 patients. (d) In a joint mouse/human clustering analysis, a distinct population of human cells (brown) clustered together with lineage-traced fibromyocytes in the mouse. (e) t-SNE visualization overlaid with expression of TNFRSF11B. (f) RNAscope in-situ hybridization of TNFRSF11B in a human coronary artery. Image is representative of 4 experiments, and scale bar represents 50μm.

