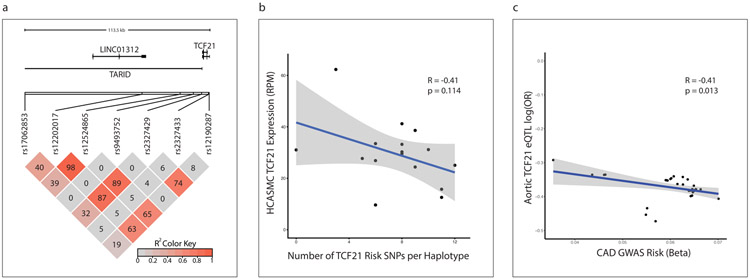
Figure 6. Reduced TCF21 expression is associated with increased coronary disease risk.
(a) Linkage disequilibrium relationships (LD, R2 measure) of all genome-wide significant CAD-associated SNPs at the 6q23.2 locus (bottom), relative to the position of TCF21 and long non-coding RNAs (LINC01312 and TARID) within the locus (top). The R2 color indicates the degree of LD between each pair of SNPs, and ranges from 0 (grey) to 1 (red). The corresponding R2 values are also shown in each box. (b) Relationship between the number of genome-wide significant CAD risk alleles in each haplotype (x-axis) and TCF21 expression (y-axis) in 52 primary human coronary artery smooth muscle cell (HCASMC) lines. (c) Correlation between the magnitude of CAD risk imparted by each risk allele (x-axis) with relative TCF21 expression from that allele (y-axis) in 36 CAD-associated SNPS at the 6q23.2 locus in aortic tissue from the STARNET database. p-value was calculated using Pearson’s moment correlation coefficient. Grey shaded areas indicate 95% confidence intervals are based on Fisher’s Z-transform.

