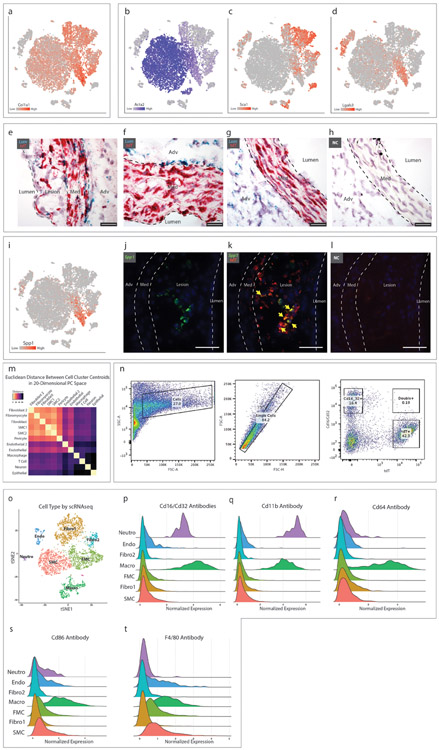
Extended Data Figure 2. SMC phenotypic modulation in the mouse aortic root.
(a-d) t-SNE visualization of cell types present in the wild-type mouse aortic root from all timepoints overlaid with expression of Col1a1, Acta2, Sca1 and Lgals3. n=9 mice. (e-f) RNAscope staining for lumican (Lum, green) and tdT (red) in (e) a plaque after 8 weeks HFD, (f) the non-diseased media of a mouse on 16 weeks HFD and (g) in a baseline healthy aorta. (h) RNAscope negative control. Images in (e-h) are representative from 2 experiments and scale bars indicate 25μm. (i) t-SNE visualization of cell types present in the wild-type mouse aortic root from all timepoints overlaid with osteopontin (Spp1) expression. n=9 mice. (j-k) RNAscope co-localization of Spp1 (green) and tdT (red) in a plaque after 16 weeks HFD. Yellow arrows indicate co-localization of Spp1 and tdT. (l) RNAscope negative control. Images from (j-l) are representative of 4 experiments, and scale bars indicate 50μm. (m) Heatmap representation of the Euclidean distance between cell cluster centroids in 20-dimensional principal component space with smallest distances in yellow and largest distances in black. Data are after 16 weeks of HFD. (n) Staining of a single cell suspension from the atherosclerotic mouse aortic root and ascending aorta with antibodies against the macrophage markers Cd16 and Cd32, and analysis of co-expression with the tdT SMC lineage marker. Data are from one experiment and n=2 mice (after 12 and 15 weeks HFD). (o-t) Single cells from the atherosclerotic mouse aortic root and ascending aorta at 16 weeks HFD were incubated with DNA-barcoded antibodies against the macrophage markers Cd16, Cd32, Cd11b, Cd64, Cd86 and F4/80 prior to undergoing scRNAseq (CITE-seq), yielding simultaneous transcriptomic and antibody binding data within each individual cell. (o) Cell type assignments were determined with scRNAseq as described previously. (p-t) Quantitative antibody binding within each cell type. Results are from one experiment and n=2 mice.

