
Figure 2. SRF and TCF21 co-localize genome-wide in HCASMC and regulate HCASMC pathways.
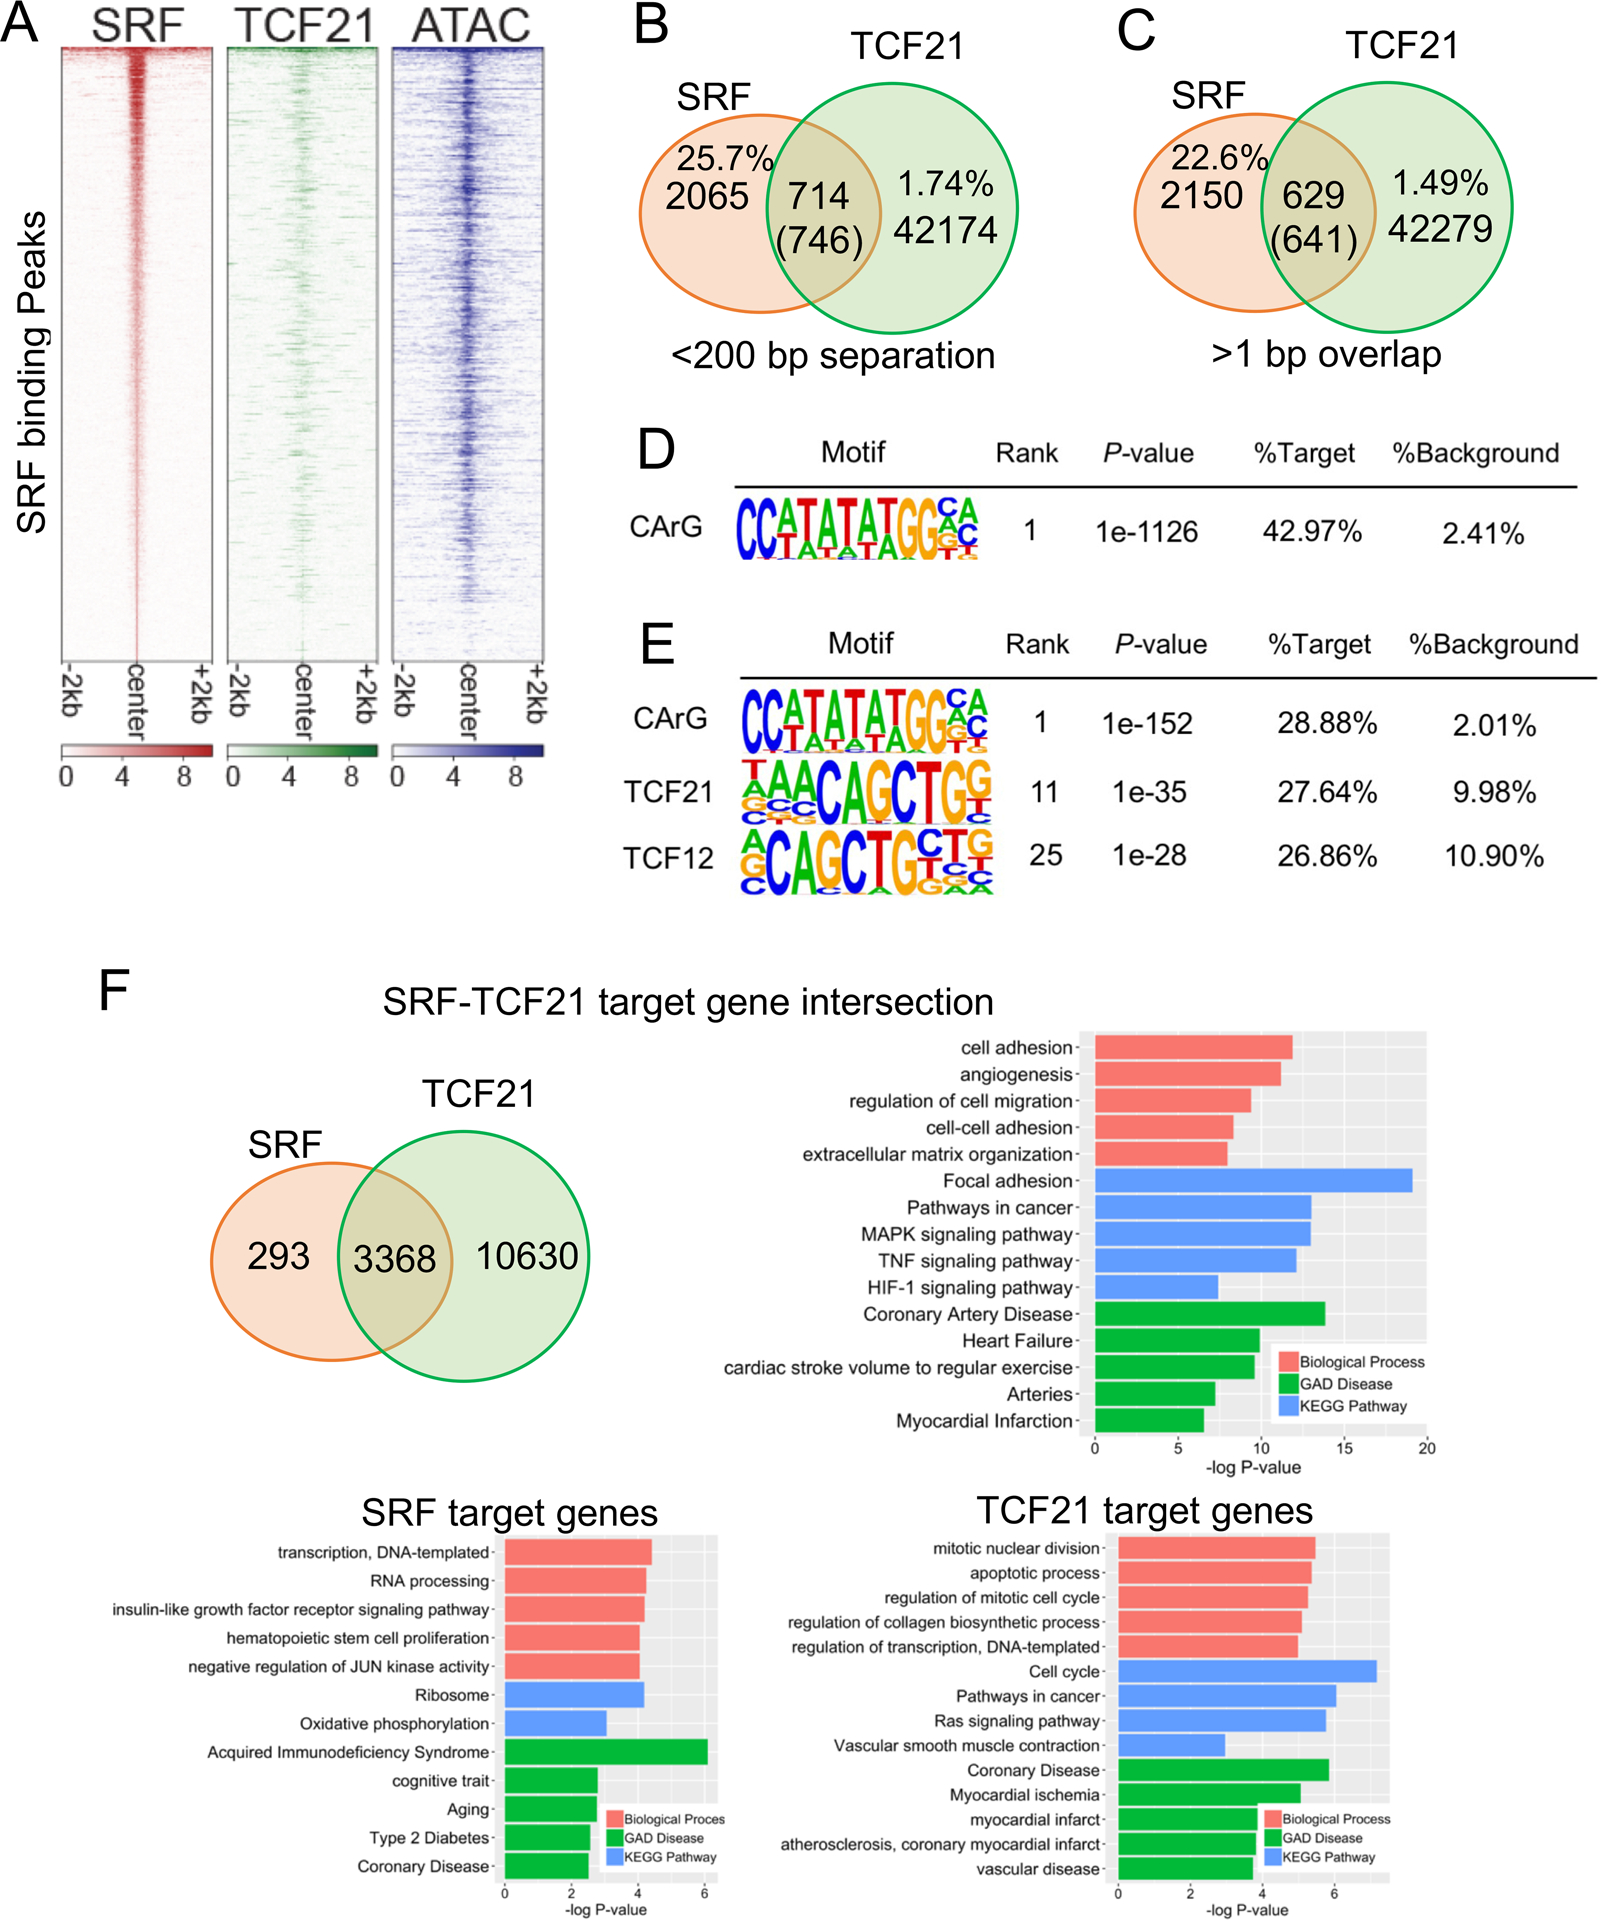
A) Heatmap distribution of SRF binding compared to previously generated TCF21 ChIP-seq and open chromatin regions (ATAC-seq), centered on SRF peaks in HCASMC within a 4-kb window. B) Venn diagram showing the number of overlaps of TCF21 and SRF peaks in the single nucleosome (<200bp separation). C) Venn diagram showing the number of direct overlaps (>1bp) of TCF21 and SRF peaks. D) Homer known motif analysis of SRF peaks identified CArG as the top motif. E) Homer known motif analysis of SRF-TCF21 joint loci showing the co-enrichment of TCF21 E-boxes and SRF CArG binding motifs. F) Venn diagram showing the number of overlapped target genes of TCF21 and SRF. Barplots show the DAVID Gene Ontology analysis of SRF target genes (bottom left), TCF21 target genes (bottom right), or intersected target genes (top right). Genes were assigned by GREAT.