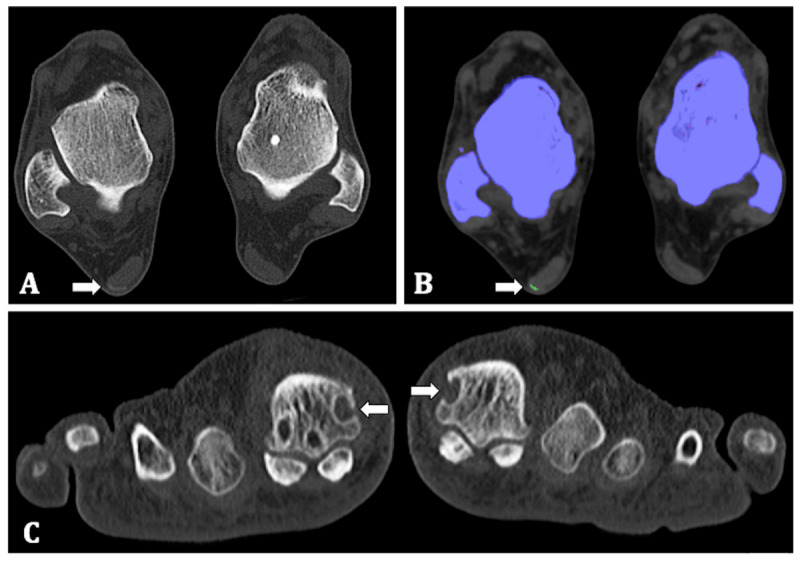
Figure 1.

65-year-old man. (A) Transverse native CT image of both feet at the level of the talus. A higher-density zone is shown in the lateral margin of the Achilles tendon (arrow). (B) Colour-coded images identified the presence of MSU crystals as a green zone (arrow). (C) Coronal native CT image, showing erosions with sclerotic border and overhanging edges in the head of the first metatarsal bone both left and right (arrows).
