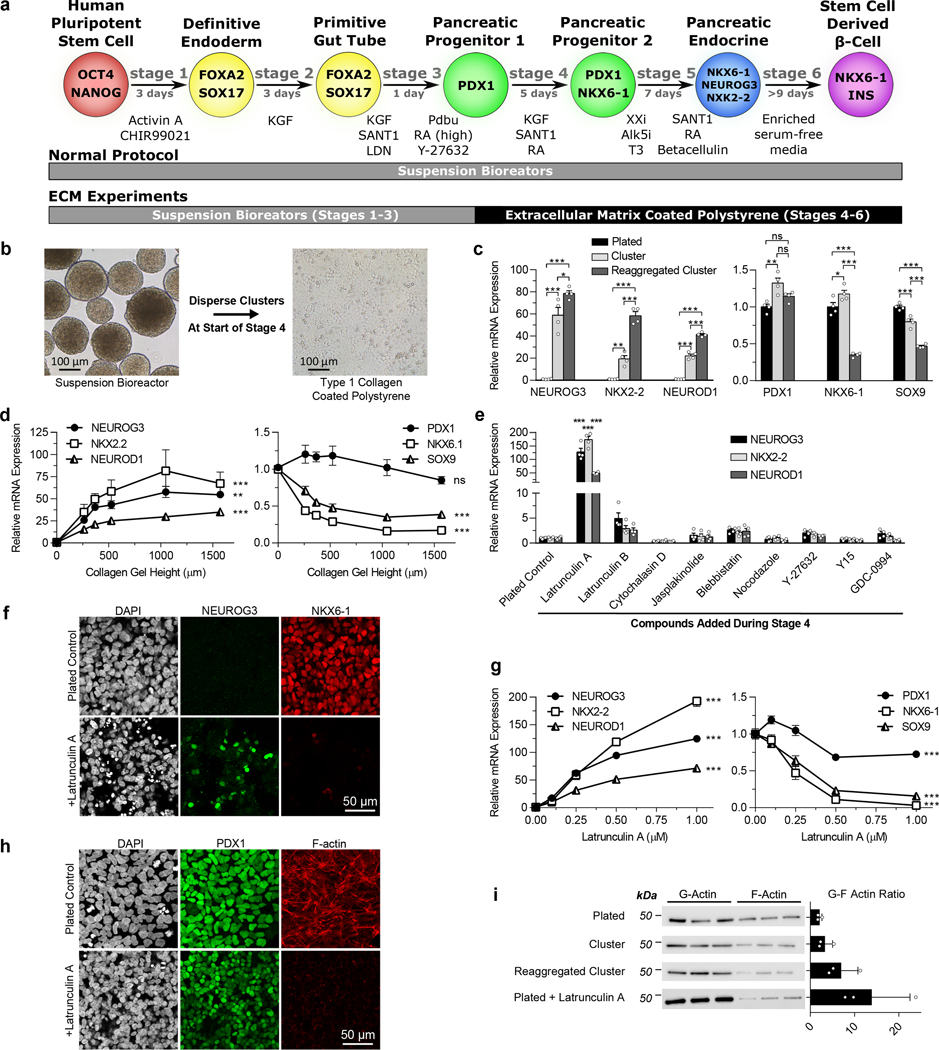
Figure 1. The state of the cytoskeleton controls expression of the transcription factors NEUROG3 and NKX6–1 in pancreatic progenitors.
(a) Schematic of the differentiation protocol5 used for suspension differentiations and plate down studies. (b) Images of clusters at the beginning of stage 4 dispersed and plated onto ECM-coated TCP for the remainder of the protocol. Scale bar = 100 μm. (c) qRT-PCR of pancreatic genes at the end of stage 4 of cells plated on collagen I at the beginning of stage 4 compared to regular suspension clusters or clusters reaggregated after dispersion (Tukey’s HSD test, n = 4). (d) qRT-PCR of pancreatic genes at the end of stage 4 of cells plated on collagen I gels of varying heights at the beginning of stage 4. Increasing the height of collagen I gels fixed to TCP correlates with decreasing the effective stiffness experienced by cells (ANOVA, n = 4). (e) qRT-PCR of plated stage 4 cells treated with some commonly used cytoskeletal-modulating compounds to identify latrunculin A as a potent endocrine inducer (Dunnett’s multiple comparisons test, n = 4). (f) Immunostaining of plated cells at the end of stage 4 demonstrating that a 1 μM latrunculin A treatment increased NEUROG3+ cells and decreased NKX6–1+ cells when administered during stage 4. Scale bar = 50 μm. (g) Latrunculin A dose response of pancreatic gene expression added during stage 4 measured with qRT-PCR (ANOVA, n = 4). (h) Immunostaining of plated stage 4 cells treated for 24 hours with 1 μM latrunculin A, demonstrating depolymerization of F-actin but maintenance of PDX1 expression. (i) Western blot quantification of the G/F actin ratio within cells under different culture formats and treated with latrunculin A (n = 3). All data was generated with HUES8. All data is represented as the mean, and all error bars represent SEM. Individual data points are shown for all bar graphs. ns = not significant, * = p < 0.05, ** = p < 0.01, *** = p < 0.001.

