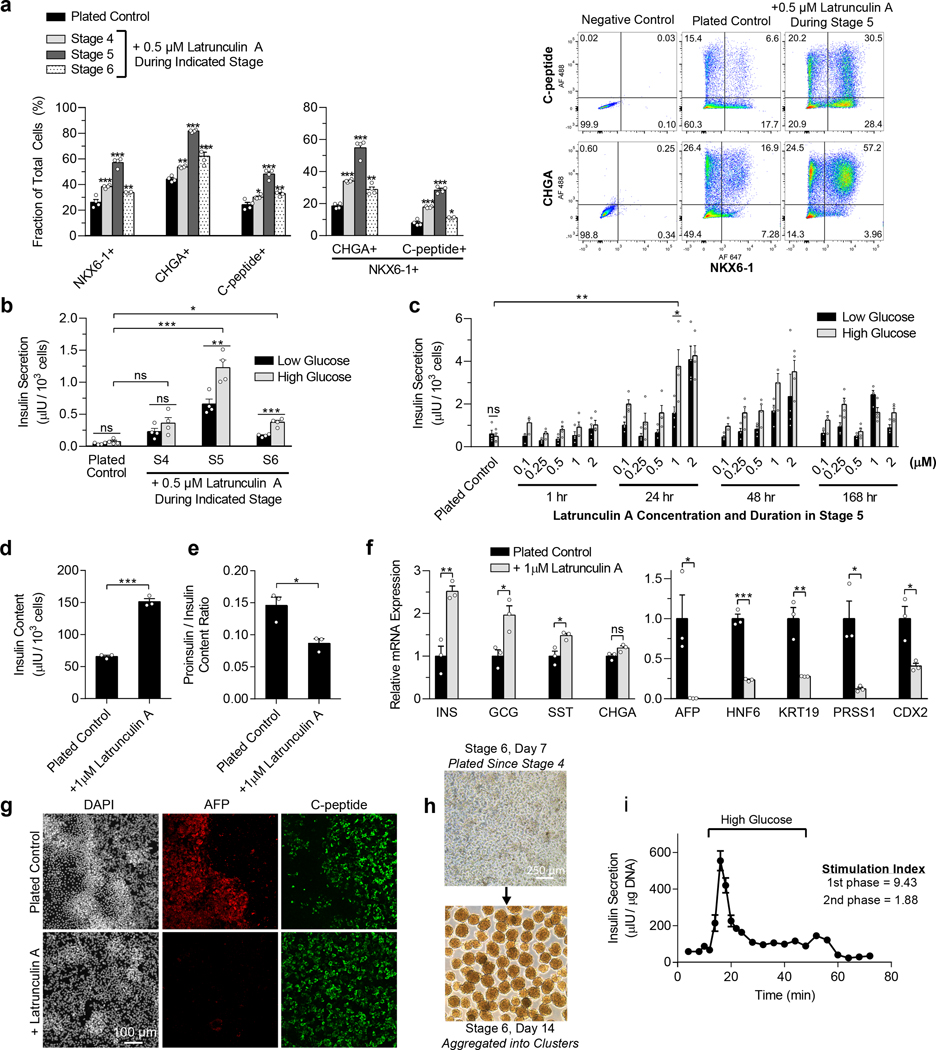
Figure 3. Latrunculin A treatment during stage 5 increases the efficiency of SC-β cell specification of plated pancreatic progenitors.
(a) Flow cytometry two weeks into stage 6 for NKX6–1, CHGA, and C-peptide of plated cells as per Fig. 1a, untreated or treated with 0.5 μM latrunculin A throughout stage 4, 5, or 6 (Dunnett’s multiple comparisons test, n = 4). (b) Static GSIS two weeks into stage 6 of plated cells, untreated or treated with 0.5 μM latrunculin A throughout stage 4, 5, or 6 (paired two-sided t-test compares between low and high glucose for a particular sample, Dunnett’s test compares insulin secretion at high glucose to the control, n = 4). (c) Optimization of latrunculin A concentration and timing during stage 5 for plated cells. Static GSIS was performed after 2 weeks of stage 6 (paired two-sided t-test compares low and high glucose, unpaired two-sided t-test compares high glucose of plated control and 24 hour 1 μM latrunculin A treatment, n = 4). (d) Insulin content of plated cells two weeks into stage 6, untreated or treated 24 hours with 1μM latrunculin A on the first day of stage 5 (unpaired two-sided t-tests, n = 3). (e) Proinsulin/insulin ratio of plated cells two weeks into stage 6, untreated or treated for 24 hours on the first day of stage 5 with 1 μM latrunculin A (unpaired two-sided t-tests, n = 3). (f) qRT-PCR measuring endocrine (left) and non-endocrine (right) gene expression of plated cells two weeks into stage 6, untreated or treated for 24 hours on the first day of stage 5 with 1 μM latrunculin A (unpaired two-sided t-tests, n = 3). (g) Immunostaining for AFP and c-peptide of plated cells two weeks into stage 6, untreated or treated for 24 hours on the first day of stage 5 with 1 μM latrunculin A. Scale bar = 100 μm. (h) Images of aggregating plated cells after one week in stage 6. Scale bar = 250 μm. (i) Dynamic glucose-stimulated insulin secretion of stage 6 cells exhibiting first and second phase insulin release (n = 3). All data was generated with HUES8. All data is represented as the mean, and all error bars represent SEM. Individual data points are shown for all bar graphs. ns = not significant, * = p < 0.05, ** = p < 0.01, *** = p < 0.001.

