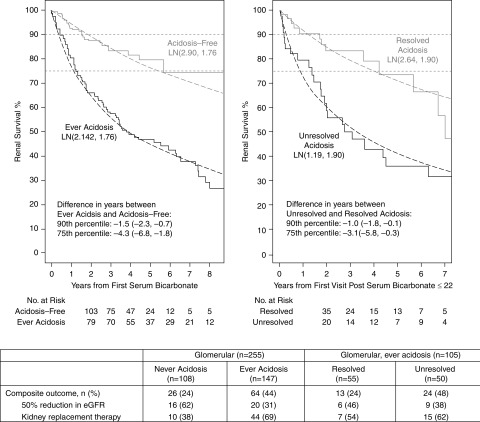
Figure 2.
Survival time to 50% decline in eGFR or KRT (transplant or dialysis) by “ever acidosis” following the first bicarbonate measurement among 255 participants with glomerular disease (left). Event-free time by acidosis persistence following the first visit after participants become acidotic among 105 participants with glomerular disease who were ever acidotic (right). Parametric Lognormal distributions for each group with location (β) and scale (σ) and denoted as LN(β, σ) are represented by dashed lines. Percentiles provided due to differences in the proportion of participants who reached the composite event. The relative percentile measure of association summarizes the difference in time (years) for the pth percentile of the exposed group (e.g., those with acidosis) compared to the unexposed group (e.g., those without acidosis).

