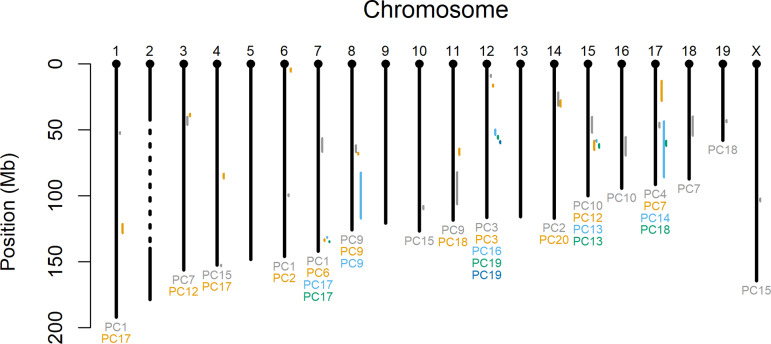
Fig 2. QTL physical map.
Mouse genome physical map with QTL support intervals. Intervals on the same chromosome are color coded to match the color of the PC for which the QTL was identified (listed below chromosome). The dashed line in the middle of chromosome 2 represents a region for which genetic effects were not evaluated due to the potential effects of transmission distortion on QTL identification (see Materials & Methods for further explanation).

