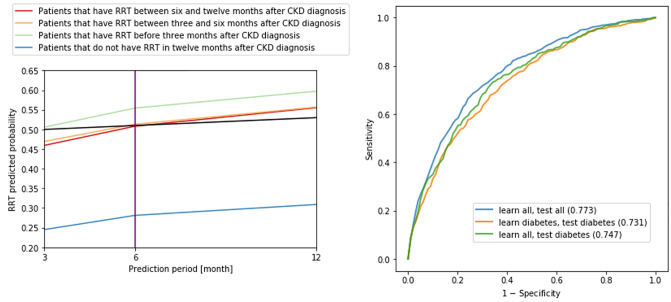
Fig 6.
Left: Predicted probabilities of needing RRT, averaged at each prediction period. Blue, red, orange and green lines show the average predicted probabilities of needing RRT for 4 distinct sets of patients as described in the legend. Three prediction periods are shown (12, 6 and 3 months), where, for each period, one Logistic Regression model is used. The black line shows the ideal threshold for all three models. More precisely, using this threshold, all the models (on average) correctly predict RRT for all subsets of patients. Right: AUCs obtained with Logistic Regression for various tests. The AUC values are shown in brackets.

