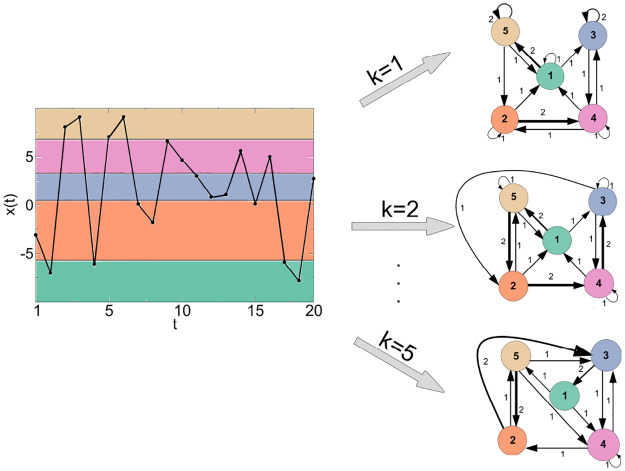
Fig 1. Example of the QG method for a time series with T = 20, Q = 5, and k = 1, 2 and 5.
The quantile intervals for the sorted data are given by [x(0), x(4)[, [x(4), x(8)[, [x(8), x(12)[, [x(12), x(16)[, and [x(16), x(20)], i.e., [−7.783, −3.050[, [−3.050, 0.829[, [0.829, 4.657[, [4.657, 7.070[, and [7.070, 9.090]. The quantiles are mapped into three networks with nodes each and arc weights given by (1,1,1), (1,3,1), (1,5,2), (2,1,1), (2,2,1), (2,4,2), (3,3,2), (3,4,1), (4,1,1), (4,2,1), (4,3,1), (4,4,1), (5,1,1), (5,2,1), (5,5,2) for k = 1; (1,3,1), (1,5,2), (2,1,1), (2,4,2), (2,5,1), (3,2,1), (3,3,1), (3,4,1), (4,1,1), (4,3,2), (4,4,1), (5,1,1), (5,2,2), (5,5,1) for k = 2; and (1,4,1), (1,5,1), (2,3,2), (2,5,1), (3,1,2), (3,4,1), (4,2,1), (4,3,1), (4,4,1), (5,2,2), (5,3,1), (5,4,1) for k = 5.

