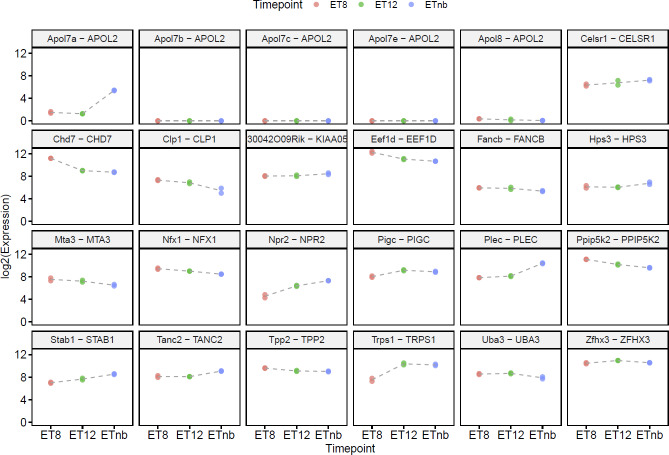
Fig 2. Murine candidate gene expression at three different timepoints.
The gene expression is shown as log2 expression on the y-axis, while the timepoint is shown as categorial variable on the x-axis. The header of each sub figure shows the murine and human gene symbols. E: embryonic day, pn: postnatal.

