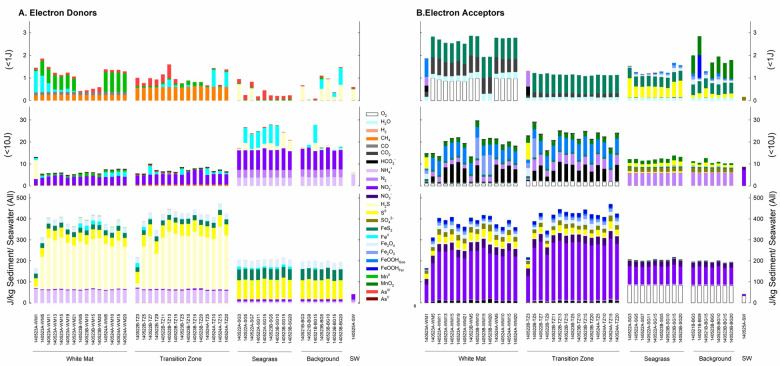
Fig 5. Energy densities at all sample locations and depths.
Colored bars refer to identities of different electron donors (A) and electron acceptors (B). The upper and middle panels zoom in on reactions with low energy yields (<1 J and <10 J, respectively). The energy densities refer to either those in 1 kg sediment or 1 kg seawater. See S1 Table for details on the reactions.

