Fig 2.
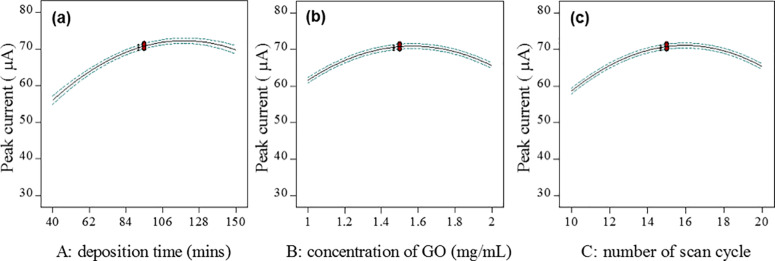
A one-factor plot of the current response as a function of (a) deposition time (concentration of GO = 1.5 mg/mL; number of scan cycles = 15), (b) concentration of GO (deposition time = 95 min; number of scan cycles = 15), and (c) number of scan cycles (concentration of GO = 1.5 mg/mL; deposition time = 95 min).

