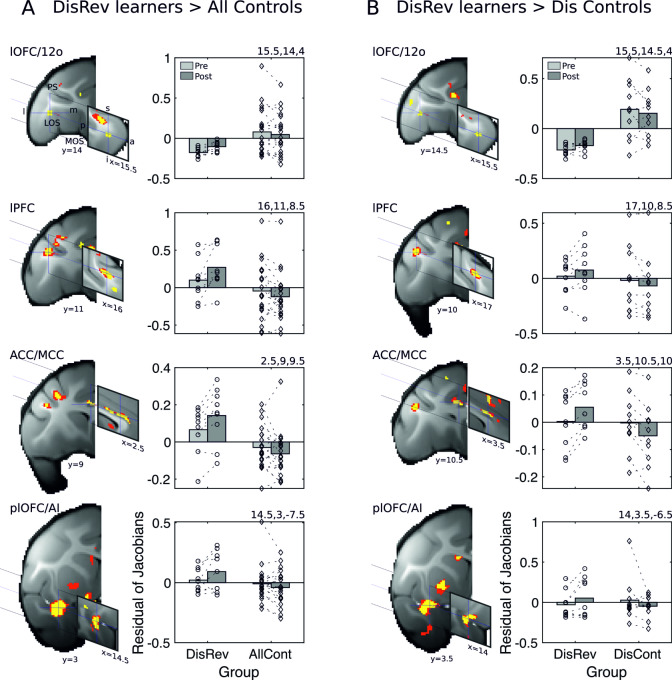
Fig 2.
Learning DisRev was associated with distributed gray matter increments (A) relative to all control animals, including in the same set of brain regions as identified in experiment 2: lOFC/12o (cross hairs in top row), ventral bank of the PS in anterior lPFC (cross hairs in second row), ACC/MCC (cross hairs in third row), and plOFC/AI (cross hairs in bottom row). Panel B illustrates that excluding NoDis Controls from the analysis revealed the same set of brain regions with increases in gray matter in lOFC/12o, ventral bank of the PS, ACC/MCC, and plOFC/AI. Results of analysis testing for bilaterally symmetrical effects (p < 0.001) are shown in yellow and red (p < 0.005). Across analyses, gray matter shows relative increases after learning in the DisRev animals and relative decreases in the NoDis Controls or Dis Controls. Because in the initial stages of analysis, all scans from both before and after training are registered to a template derived from their group average, the baseline residual Jacobian values in each figure lie close to the mean. 12o, orbital part of area 12; a, anterior; ACC/MCC, anterior cingulate cortex/midcingulate cortex; AI, anterior insula; AllCont, all control; Dis Control, discrimination control; DisRev, discrimination reversal; I, inferior; l, lateral; lOFC, lateral OFC; lPFC, lateral prefrontal cortex; m, medial; LOS, lateral orbital sulcus; MOS, medial orbital sulcus; NoDis Control, no-discrimination control; OFC, orbitofrontal cortex; p, posterior; plOFC, posterior lOFC; plOFC/AI, plOFC extending into AI; PS, principal sulcus; s, superior. Data are available on https://www.jeromesallet.org/data-ofc-reversal-learning and https://doi.org/10.5281/zenodo.3776631.

