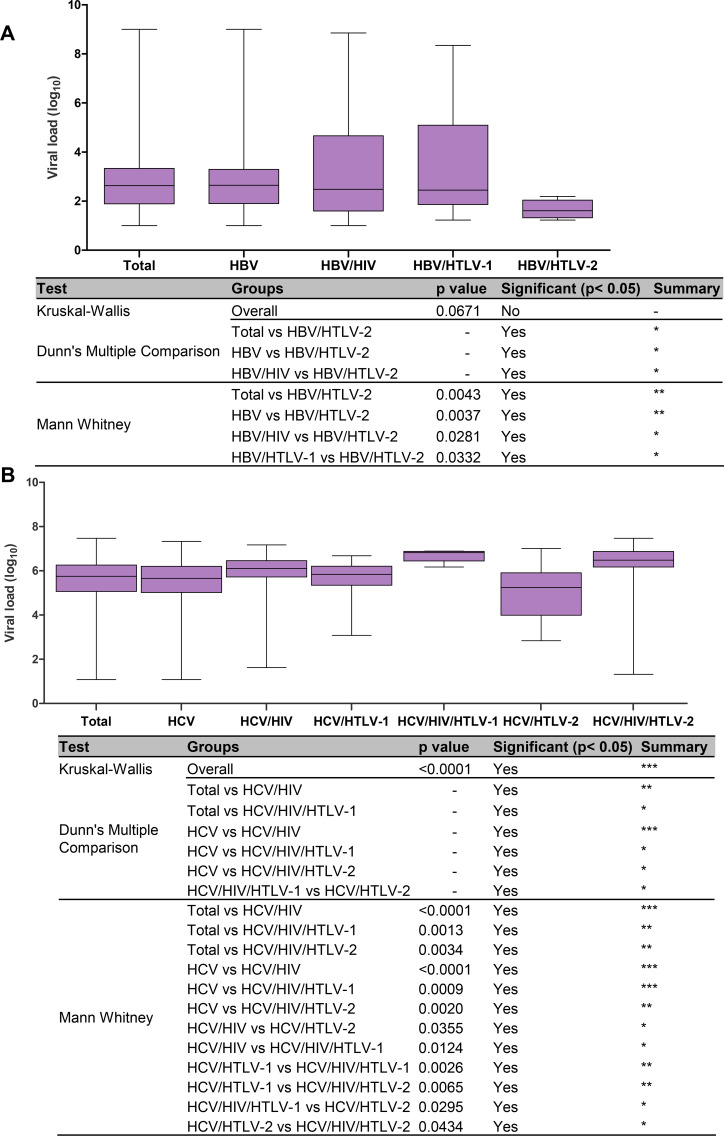
Fig 2.
HBV (A) and HCV (B) viral load results according to the type of viral infection or coinfection. The Kruskall-Wallis test was used for statistical analysis (three groups or more), complemented with Dunn’s Multiple Comparison test, and the Mann-Whitney U-test (two groups). p-values depicted as asterisks correspond to:*, p<0.05; **, p≤0.01; *** p≤0.001.

