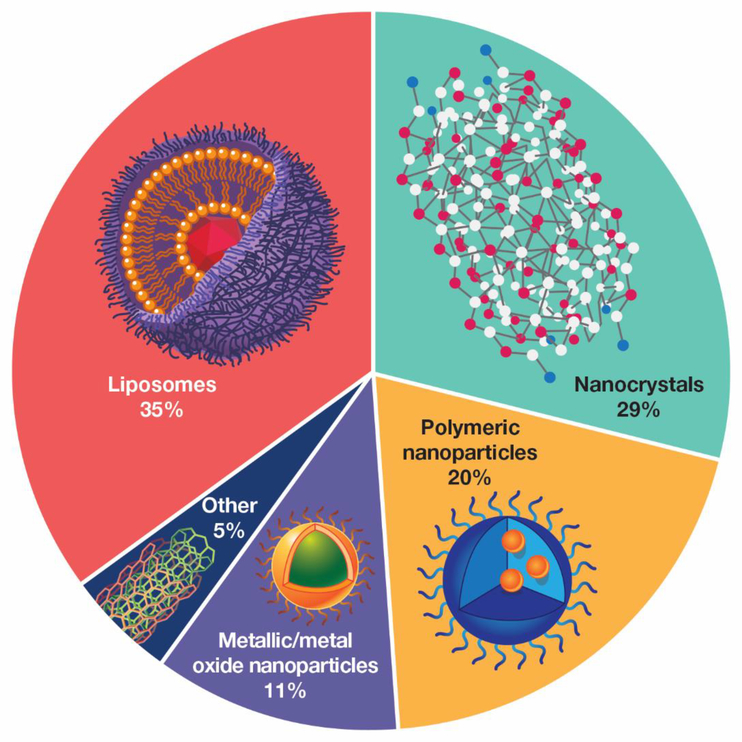
Figure 1.
Pie chart showing relative distribution of nanomaterials used in drug products that were submitted to the FDA from 2010–2015 (Adapted from D’Mello et al.(5)). The chart has been simplified by grouping related materials. For example, polymeric NPs includes iron-polymer complexes, micelles, dendrimers, and polymeric NPs.

