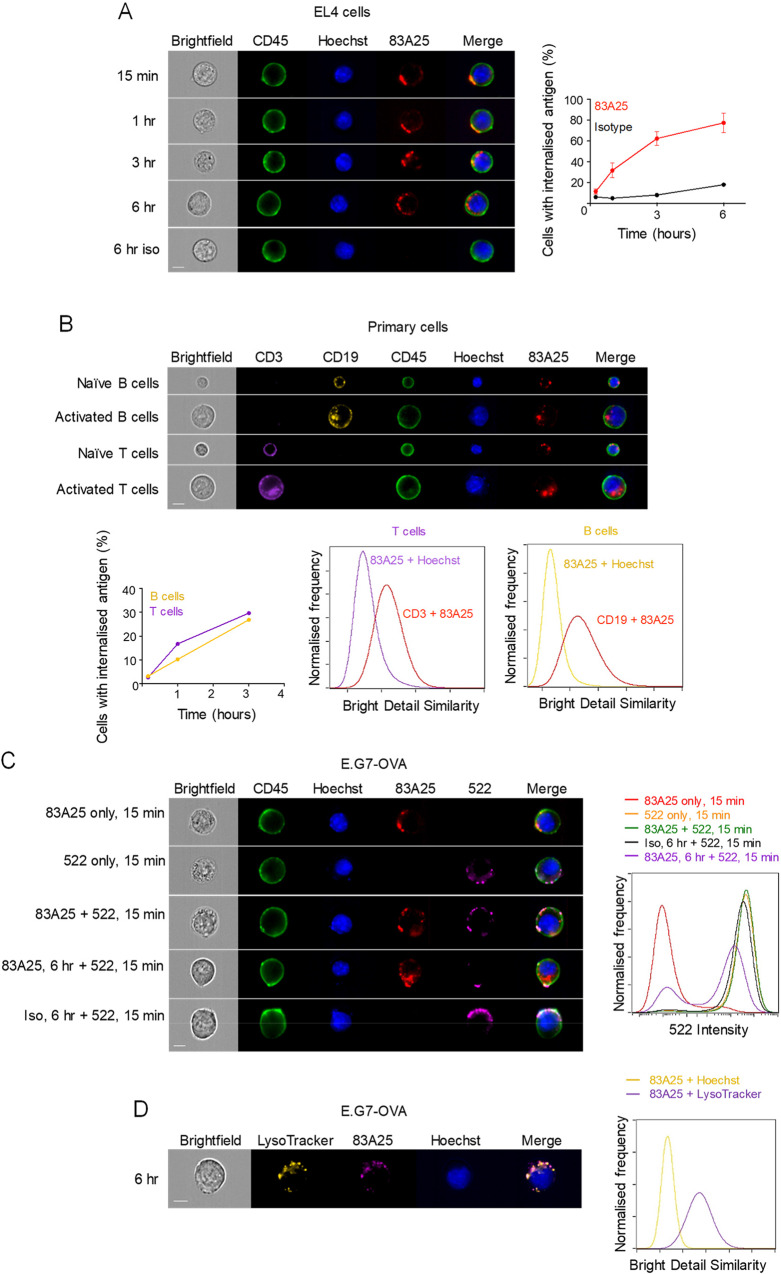
Fig 2. Endogenous MLV envelope is internalised by EL4 cells and primary lymphocytes.
(A) IS images of EL4 cells incubated with 83A25 antibody for specified periods of time and counterstained with anti-CD45 and Hoechst (left). Percentage of cells with internalised envelope-antibody complexes (right) over time from four independent experiments. A minimum of 5000 cells were analysed in each experiment at each time point. Scale bar = 7 μm. (B) Splenocytes were imaged by IS in the naïve state or were activated with LPS or CD3/CD28 Dynabeads for 48 hours. Prior to imaging, cells were incubated with 83A25 antibody for specified periods of time. At the end of incubation with 83A25, cells were labelled with anti-CD45, anti-CD3, anti-CD19 and Hoechst. Three-hour time point images are shown (top). Percentage of activated cells with internalised env-antibody complexes at specified time points (bottom left). Co-localisation of 83A25 with CD19 in B cells and CD3 in T cells (bottom right) was quantified using the Bright Detail Similarity feature in IDEAS and compared to Hoechst, a non-colocalising probe. A minimum of 10000 cells were analysed at each time point. Scale bar = 7 μm. (C) Antibody binding to MLV envelope reduces the number of envelope molecules present on the cell surface. E.G7-OVA cells were incubated with either 83A25, 522, isotype control antibody or a combination of these for defined periods of time and counterstained with anti-CD45 and Hoechst. Images (left) and fluorophore signal intensities (right) were recorded by IS. Data representative of three independent experiments with a minimum of 10000 cells analysed per treatment group. Scale bar = 7 μm. (D) Internalised envelope-antibody complexes localise to acidic endosomal/lysosomal compartments. IS images of E.G7-OVA cells incubated with pHrodo-conjugated 83A25 for three hours and stained with LysoTracker and Hoechst dyes (left). Co-localisation of 83A25 with LysoTracker was quantified using the Bright Detail Similarity feature in IDEAS and compared to Hoechst, a non-colocalising probe (right). Scale bar = 7 μm.

