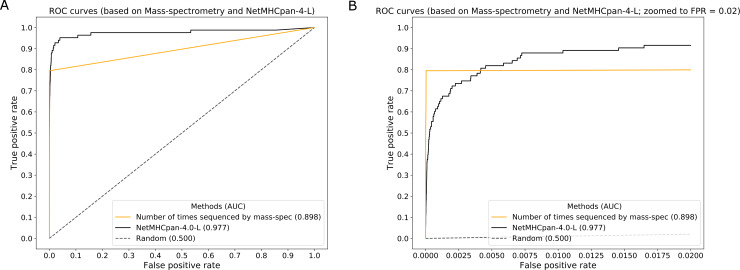
Fig 5. ROC curves comparing epitope candidate selection using mass-spectrometry and prediction approaches.
The curves were generated from the number times a precursor ion was selected for MS/MS which acts as a proxy for the abundance of a peptide and represents MS and NetMHCpan-4.0-L prediction scores. 5A. ROC curves comparing epitope candidate selection using mass-spectrometry and prediction approaches. Plot showing 100% FPR. 5B. ROC curves comparing epitope candidate selection using mass-spectrometry and prediction approaches. Plot showing up to 2% FPR.

