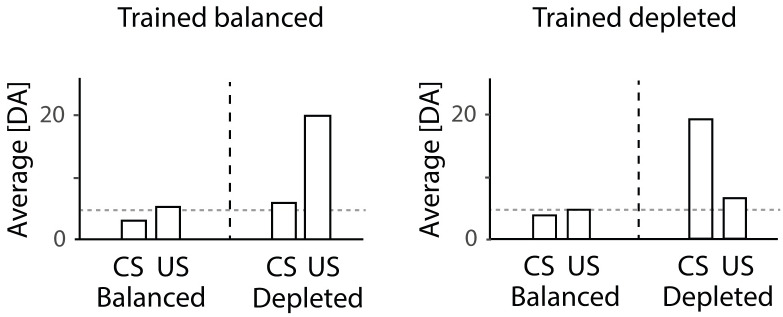
Fig 1. State-dependent modulation of dopaminergic responses.
Experimental data by Cone et al. [26] shows dynamic changes in dopaminergic responses based on the state of the animal. The two graphs within the figure correspond to dopaminergic responses in animals trained in a balanced and depleted state, respectively, re-plotted from figures 2 and 4 in the paper by Cone et al. [26]. Within each graph, the left and right halves show the responses of animals tested in balanced and depleted states, respectively. The horizontal dashed lines indicate baseline levels.

