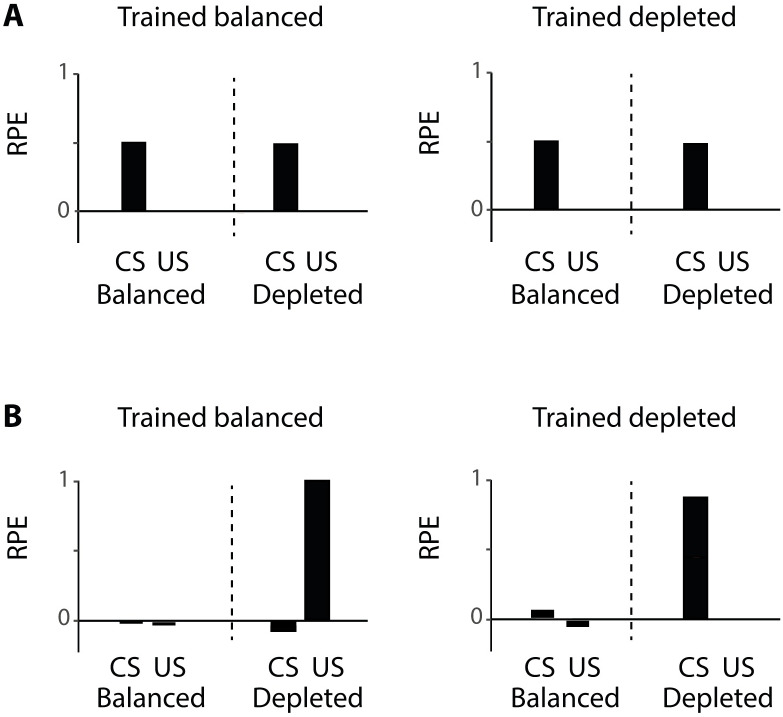
Fig 3. Simulation of data by Cone et al. [26] with different reward prediction errors.
A) Simulation with classical reward prediction error using Eq (1). B) Simulation with state-dependent prediction error described in Eq (8). Within each graph, the left and right halves show the reward prediction error (RPE) of simulated animals tested in balanced and depleted states, respectively. CS = conditioned stimulus, US = unconditioned stimulus. Each simulation consisted of 50 training trials, 1 test trial and was repeated 5 times, similar to the number of animals in each group in the study by Cone et al. [26]. Error bars are equal to zero as there is no noise added to the simulation and all simulations converged to the same value.

