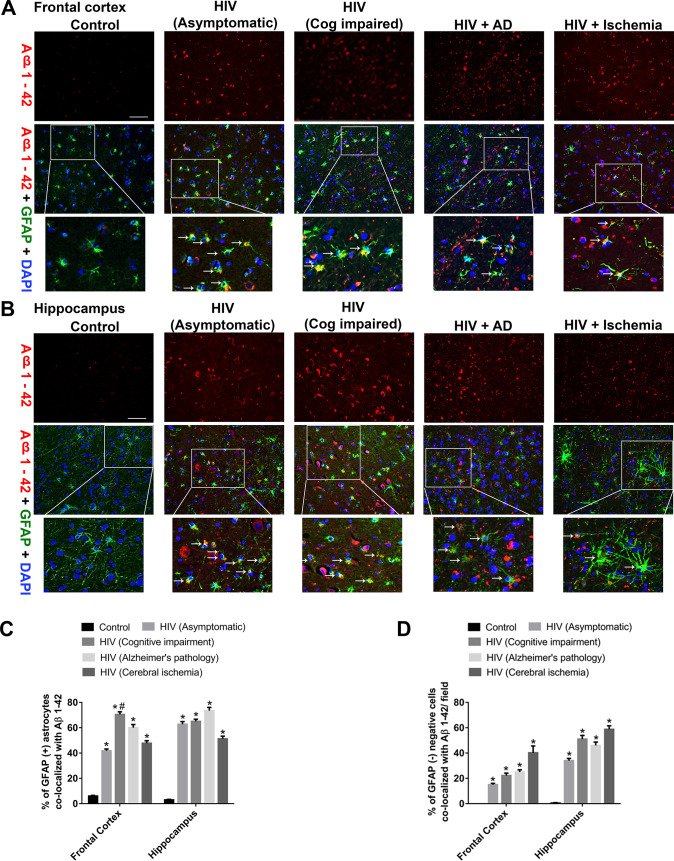
Fig 2. Differential expression of Aβ1–42 in the FC and Hp of patients infected with HIV.
Representative fluorescent photomicrographs from different groups exhibiting differential expression of Aβ1–42 in GFAP+ astrocytes in the in the FC (A) and H (B), Scale bar, 10 μm. Quantitative analysis of percent of GFAP+ astrocytes (C) and GFAP− cells (D) colocalized with Aβ1–42. Ten fields from each brain region/patient were analyzed. One-way ANOVA followed by Bonferroni post hoc test was used to determine the statistical significance: *P < 0.05 versus control, #P < 0.05 versus HIV (ASYMPTO), (COG IMP). Data are presented as mean ± SEM. Arrows indicate GFAP-positive astrocytes colocalized with Aβ 1–42. The data underlying this figure may be found in S2 Data. AD, Alzheimer disease; Aβ, amyloid beta; FC, frontal cortex; GFAP, glial fibirillary acidic protein; Hp, hippocampus.

