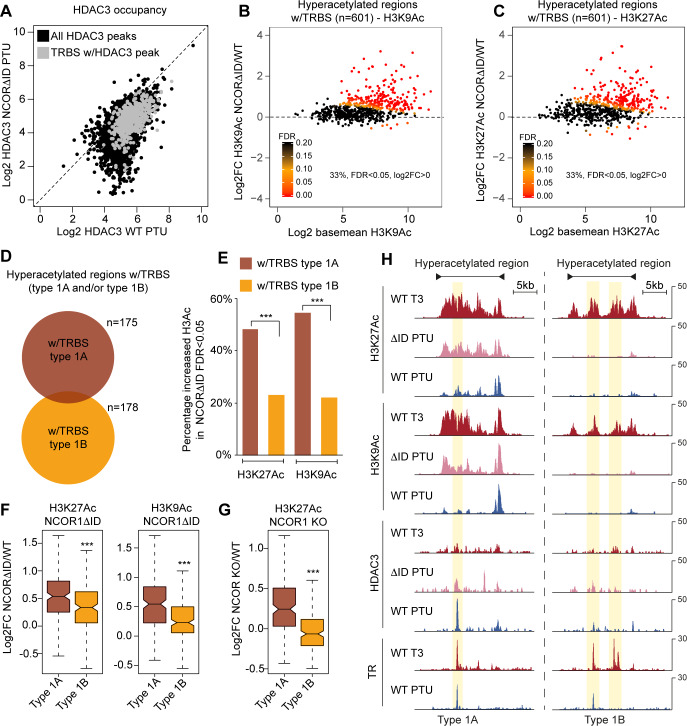
Fig 4. Histone acetylation of TR occupied regions due to disrupted interaction between TR and NCoR.
(A) HDAC3 occupancy of chromatin in WT mice and mice expressing a mutated NCOR1 (NCOR1ΔID) unable to interact with TR. TRBSs occupied by HDAC3 are marked with grey. (B) Differential H3K9Ac of hyperacetylated regions in WT hypothyroid mice compared to hypothyroid NCOR1ΔID mice. (C) Differential H3K27Ac of hyperacetylated regions in WT hypothyroid mice compared to hypothyroid NCOR1ΔID mice. (D) Genomic overlap of hyperacetylated regions occupied by TR (w/TRBS) and low or high occupancy of NCOR1-HDAC3. (E) Fraction of hyperacetylated regions with increased H3K9Ac and H3K27Ac in livers from hypothyroid L-NCOR1ΔID mice compared to hypothyroid WT mice. ***Fisher’s exact test p< 0.001. (F) Fold change of H3K9/27Ac at hyperacetylated regions occupied by TR and associated with high and low occupancy of NCOR1-HDAC3 in livers from hypothyroid L-NCOR1ΔID mice compared to hypothyroid WT mice. Statistical difference was determined by a Wilcoxon Signed Rank Test, ***p<0.001. (G) Fold change of H3K27Ac at hyperacetylated regions occupied by TR and associated with high and low occupancy of NCOR1-HDAC3 in livers from hypothyroid NCOR1 KO mice compared to hypothyroid WT mice. Statistical difference was determined by a Wilcoxon Signed Rank Test, ***p<0.001. (H) Examples of hyperacetylated regions occupied by type 1A TRBS (left, chr16:21,817,000–21,842,000) and type 1B TRBS (right, chr2:167,527,000–167,558,000).

