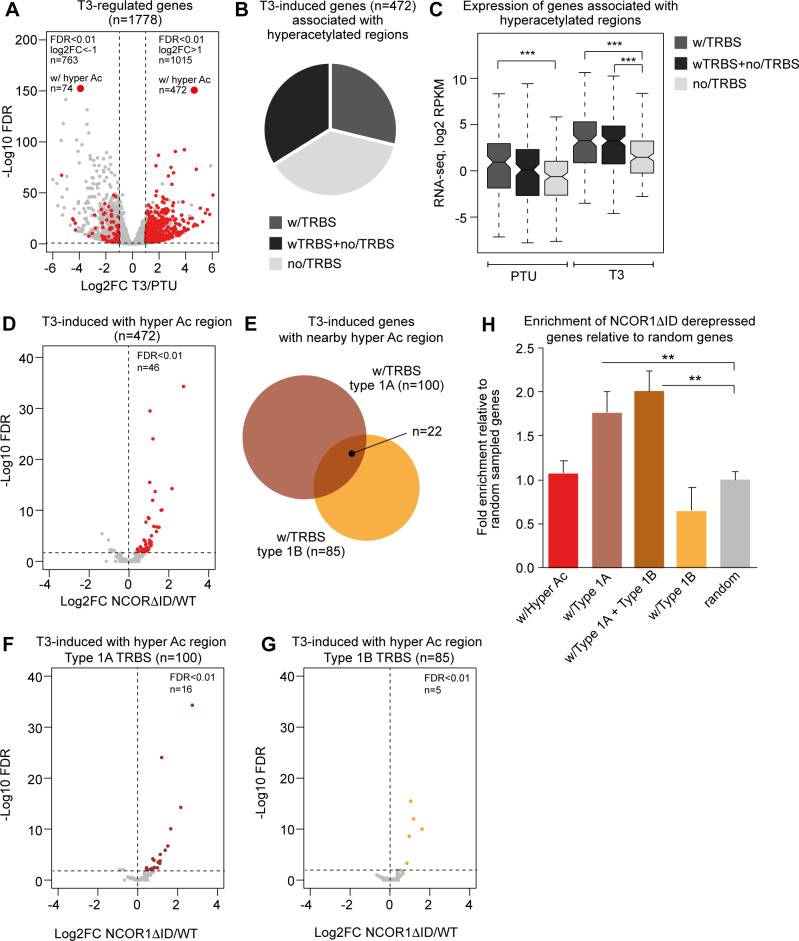
Fig 5. Expression of genes associated with hyperacetylated regions with and without occupancy of HDAC3.
(A) Differentially expressed genes in hyperthyroid condition. Genes associated with hyperacetylated regions are marked by red. Genes are scored positive if one or more hyperacetylated regions are within 100kb of the transcriptional start site of the gene. The number of induced and repressed genes at FDR<0.01 and log2FC of one are indicated. (B) Fraction of T3-induced genes with nearby hyperacetylated regions with and without TRBSs. (C) Expression of genes associated with hyperacetylated regions as sequenced reads per kilo base per million total reads (RPKM). Statistical difference was determined by a Wilcoxon Signed Rank Test, ***p<0.001. (D) Differential expression of T3-induced genes associated with hyperacetylated regions in hypothyroid WT mice compared to hypothyroid L-NCOR1ΔID mice. Red marks induced genes in L-NCOR1ΔID mice at FDR<0.01 and log2FC>0. (E) Number of T3-induced genes associated with hyperacetylated type 1A (brown) or type 1B (orange) TRBSs. (F) Differential expression of T3-induced genes associated with type 1A TRBSs in hypothyroid WT mice compared to hypothyroid L-NCOR1ΔID mice. Brown marks induced genes in L-NCOR1ΔID mice at FDR<0.01 and log2FC>0. (G) Differential expression of T3-induced genes associated with hyperacetylated regions occupied by type 1B TRBSs in hypothyroid WT compared to hypothyroid L-NCOR1ΔID mice. Yellow marks induced genes in L-NCOR1ΔID mice at FDR<0.01 and log2FC> 0. (H) Enrichment of genes induced in hypothyroid L-NCOR1ΔID mice relative to random selected genes. Genes are binned according to association with hyperacetylated type 1A and/or type 1B TRBSs. Ten different sets of 1000 randomly selected genes from all annotated genes were used as control. Statistical difference is calculated using a Student’s t-test (n = 10), **p<0.01.

