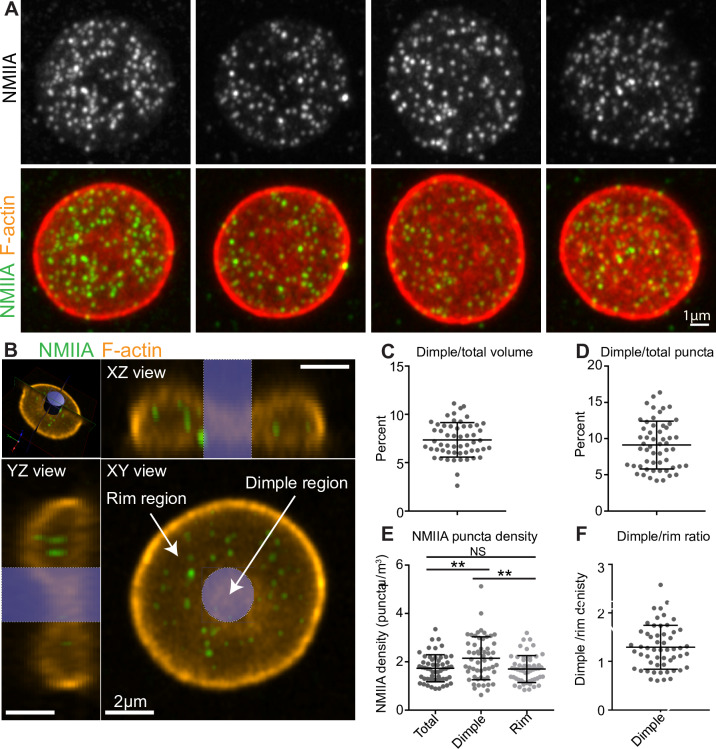
Fig 6. Experimental measurement of NMII puncta.
The RBC dimple has a higher average NMIIA puncta density than the RBC rim. (A) Maximum intensity projections of super-resolution Airyscan confocal Z stacks of individual human RBCs immunostained with an antibody to NMIIA motor domain (grey scale, top row), together with merged images (second row) of NMIIA (green) and rhodamine phalloidin for F-actin (red). (B) Schematic illustrating volume segmentation of RBCs and NMIIA puncta distribution. Optical section of a super-resolution Airyscan confocal Z-stack of human RBC immunostained with an antibody to the motor domain of NMIIA (green) and rhodamine-phalloidin for F-actin (orange). The top left image shows a perspective view of the optical section. Top right and bottom left images show YZ and XZ slices, respectively, of the RBC from planes perpendicular to this optical section. The bottom right image shows an XY view of the optical section. The blue cylinder represents the region identified as the dimple region. The rest of the RBC is identified as the rim region. Note, the myosin puncta near the RBC membrane are difficult to visualize in these merged images due to the bright F-actin staining. (C) The percent of total RBC volume occupied by the dimple region. Mean ± S.D. = 7.37 ± 1.79. (D) The percent of total NMIIA puncta in the dimple region. Mean ± S.D. = 9.11 ± 3.30. (E) The RBC dimple region has a ~25% higher density of NMIIA puncta than whole RBCs (Total) (p = 0.0051) or the rim region (p = 0.0023) by Tukey’s multiple comparisons test. Mean ± S.D.: Total = 1.73 ± 0.562; Dimple = 2.15 ± 0.888; Rim = 1.70 ± 0.556. (F) Ratio of dimple and rim region NMIIA puncta densities for each RBC. Mean ± S.D. = 1.29 ± 0.452. (C-F) n = 55 RBCs from 3 individual donors.

