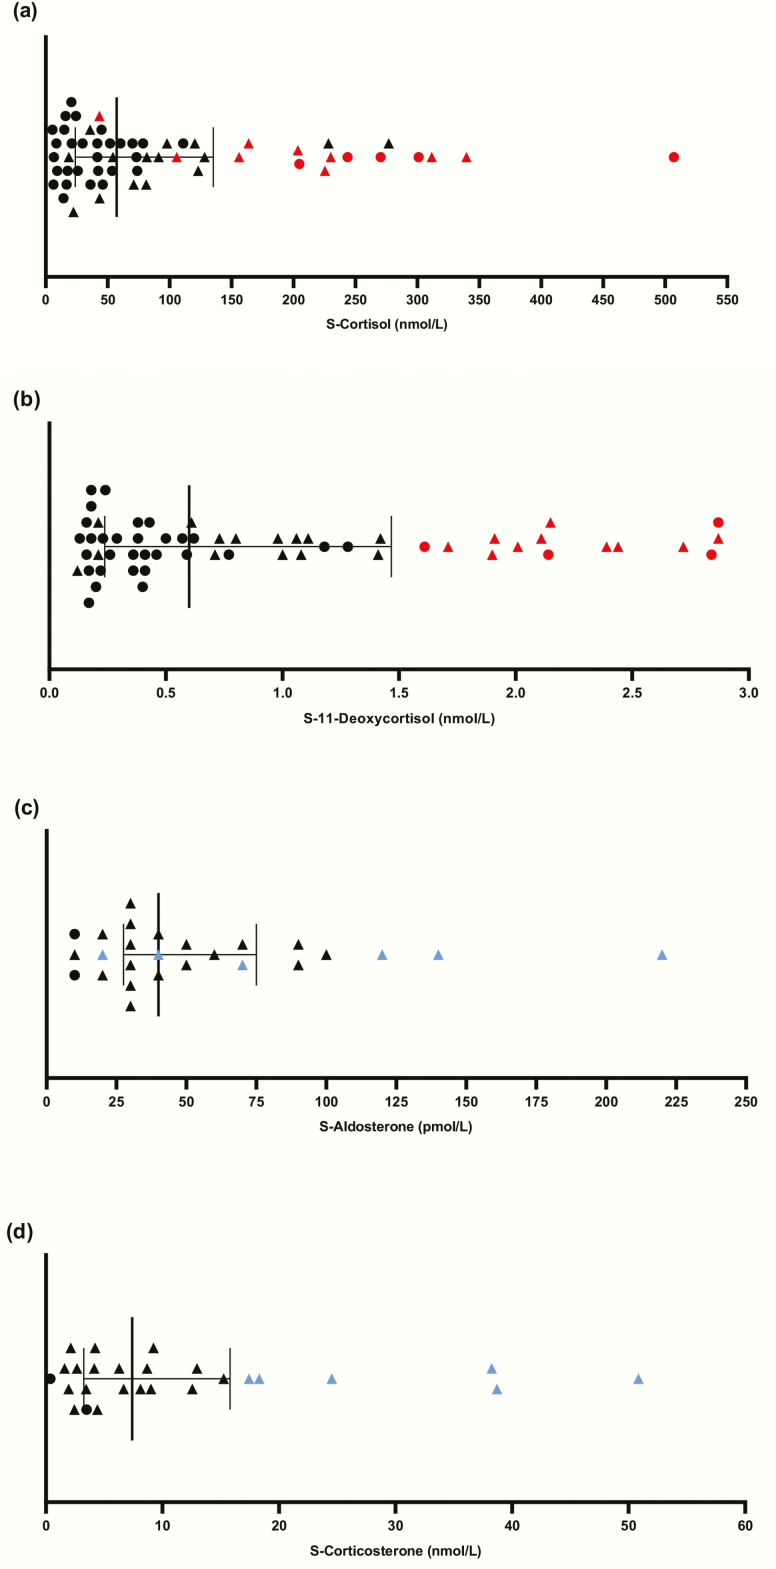
Figure 3.
Stage 1: Corticosteroid levels in patients with residual glucocorticoid or mineralocorticoid production. The line marks median corticosteroid values and the whiskers the interquartile range. Triangles mark patients with both glucocorticoid and mineralocorticoid residual production. The patients with the highest quartile of 11-deoxycortisol and corticosterone values are marked in red and blue, respectively. (A) Serum cortisol at baseline (n = 58). (B) Serum 11-deoxycortisol values at baseline (n = 58). (C) Serum aldosterone values at baseline (n = 26). (D) Serum corticosterone values at baseline (n = 26).

