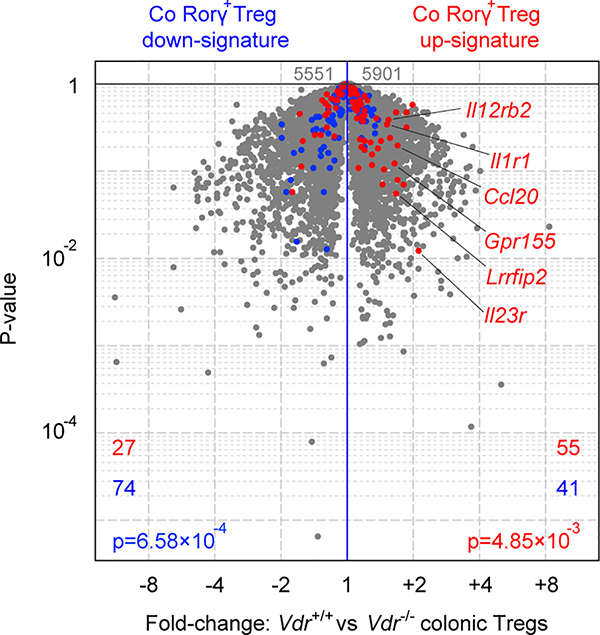
Extended Data Fig. 8. Comparison of RORγ+ Treg signature genes of colonic Tregs from Vdr+/+ and Vdr–/– mice.
Volcano plots comparing transcriptomes of colonic Tregs from Vdr+/+Foxp3mRFP and Vdr–/–Foxp3mRFP mice (n = 3). Colonic RORγ+ Treg signature genes are highlighted in red (up-regulated) or blue (down-regulated). The number of genes from each signature preferentially expressed by one or the other population is shown at the bottom. Data are pooled from two independent experiments. n represents biologically independent animals. To determine the enrichment of certain gene signatures in RNA-seq data sets, a Chi-square test was used. p values of < 0.05 were considered statistically significant.

