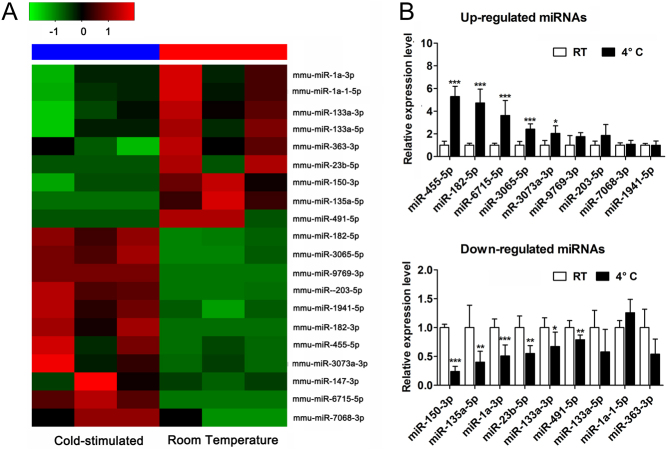
Figure 1.
Global analysis of miRNAs regulated during mouse BAT activation by cold expoure. (A) Heatmap of miRNA sequencing results from the samples treated with cold exposure or room temperature for 7 days (n = 3 respectively for RT or 4°C groups). Red bars indicate higher expression (compared with value 1), and green bars indicate lower expression (compared with value −1). Black bars indicate the median expression between red and green bars. (B) Relative expression level of the selected miRNAs upregulated or downregulated in mouse BAT after cold exposure were validated by real-time PCR (n = 12 for each group). U6 expression was used as internal control for miRNA expression analysis. Values are the means ± s.d. *P < 0.05; **P < 0.01; ***P < 0.001.

 This work is licensed under a