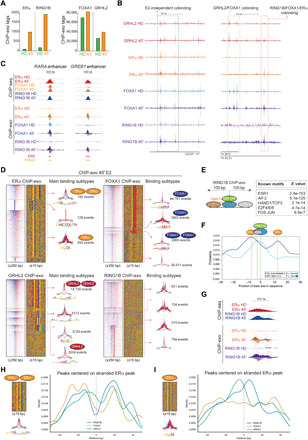
Fig. 6. Single-nucleotide binding resolution of ERα, RING1B, FOXA1, and GRHL2 identified by ChIP-exo.

(A) Number of ERα, RING1B, FOXA1, and GRHL2 ChIP-exo tags identified in HD and after 45′ of E2. (B) Genome browser screenshots of GRHL2, RING1B, ERα, and FOXA1 ChIP-exo at CDC27 and MYC loci in HD and after 45′ of E2. (C) Genome browser screenshots of RING1B, ERα, and FOXA1 ChIP-seq and ChIP-exo at RARA and GREB1 enhancers in HD and after 45′ of E2. (D) Heat maps and sequence color plots of binding subtypes identified in ERα, FOXA1, GRHL2, and RING1B ChIP-exo after 45′ of E2. On the right of each sequence color plot, see the distribution of the ChIP-exo tag patterns at each of the main subclass binding events identified in ERα, RING1B, FOXA1, and GRHL2 ChIP-exo experiments and the number of events. (E) MEME analysis of known TF motifs identified within 100 bp from the summit of the RING1B tags. (F) Distribution of ESR1 (ERα) and JUN cognate sequences respective to the submit of the RING1B tags. (G) Genome browser screenshots of RING1B and ERα ChIP-seq and ChIP-exo in HD and after 45′ of E2. Boxes represent distance between the submit of ChIP-exo tags. (H) Distribution of FOXA1, GRHL2, and RING1B ChIP-exo tags relative to stranded ERα tags containing a full ERE motif [ERα subtype 1 in (D)]. (I) Distribution of FOXA1, GRHL2, and RING1B ChIP-exo tags relative to stranded ERα tags containing half ERE motif [ERα subtype 3 in (D)].
