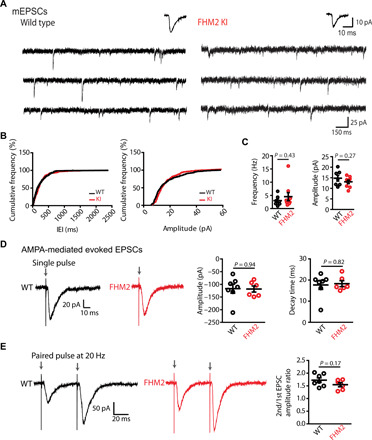
Fig. 3. Baseline synaptic activity is similar in L5 pyramidal cells of FHM2 and WT mice.

(A) Representative example traces (6 s) of whole-cell mEPSCs recordings from WT mice (left) and FHM2 KI mice (right). Average mEPSCs are shown above the traces. (B) Cumulative frequency plots of interevent intervals (IEI) (left) from WT and FHM2 KI and cumulative frequency plot of mEPSCs amplitudes from the same cells (right) calculated from the presented traces above. (C) No difference is observed in mEPSCs frequency between WT and FHM2 KI slices. Data points represent individual cells. (D) Left: Example traces of AMPA-mediated evoked EPSCs following a single pulse in WT (black) and FHM2 mice (red). Right: The amplitude of EPSCs following a single pulse is similar in WT and FHM2 mice. Decay kinetics are also similar in WT and FHM2 KI mice. (E) Left: Example traces of AMPA-mediated evoked EPSCs following a paired-pulse stimulation at 20 Hz in WT and FHM2 mice. Right: The second-to-first EPSC amplitude ratio is not different in WT compared to FHM2 mice. Data are means ± SEM. Two-tailed unpaired t test was used.
