. 2020 May 27;9:e53853. doi: 10.7554/eLife.53853

Figure 6. Insights into the OAD reaction cycle.

(a) Sodium binding to the StOAD βγ sub-complex is affected by pH. The dissociation constants (Kd(Na+)) derived from ITC experiments at different pH is plotted against the proton concentration. Error bars represent errors derived from fitting the ITC data to the one set of sites model. The solid lines indicate data fitting with the competitive binding model. The y- and x-axis intercepts of the lines indicate the values for the absolute dissociation constants for sodium and proton (KD(Na+) and KD(H+)), respectively. (b) A model of the OAD-catalyzed sodium transport. Components in the β subunit are colored as in Figure 1. For simplicity, only one β subunit is shown and its domain E is omitted. The gray bars indicate the membrane bilayer. The letter ‘D’ indicates the direct proton donor for carboxyl-biotin decarboxylation.

Figure 6—source data 1. Summary of ITC experiments at different pH.
elife-53853-fig6-data1.xlsx (335.1KB, xlsx)
Figure 6—source data 2. Dissociation constants of sodium binding to the StOAD βγ sub-complex at different pH measured by ITC.
Figure 6—source data 3. Enthalpy of sodium binding to the StOAD βγ sub-complex at different pH measured by ITC.

Figure 6.

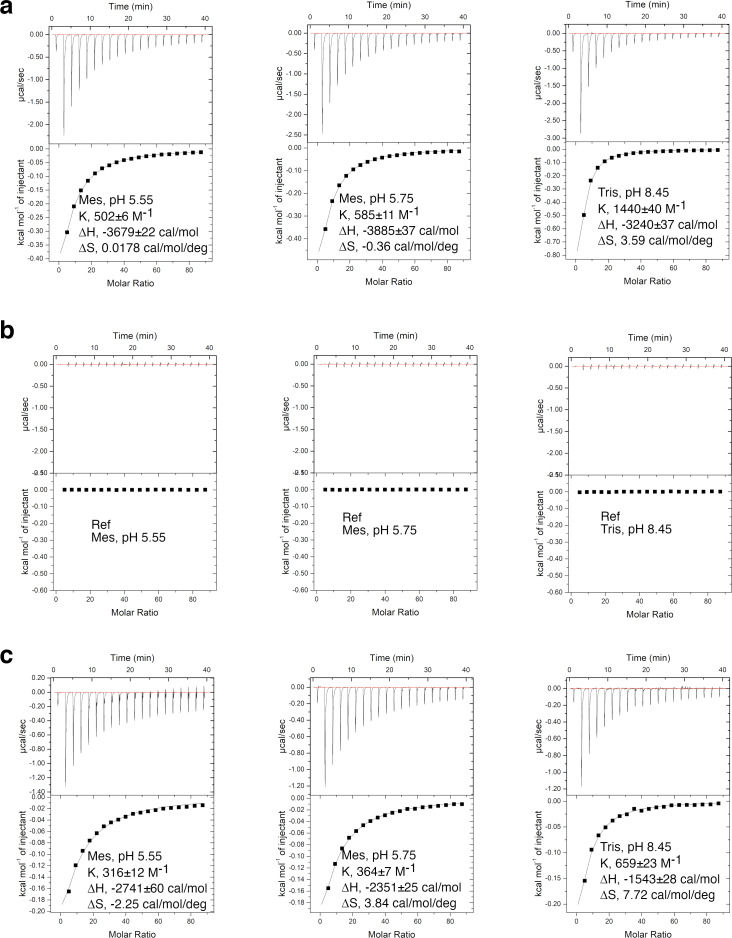
Figure 6—figure supplement 1. ITC experiments probing sodium binding to the wild type (a) and the E40A substituted (c) StOAD βγ sub-complex at different pH.

Figure 6—figure supplement 1.

(b) Reference experiments carried out in the absence of the StOAD βγ sub-complex.
Figure 6—figure supplement 2. ITC-measured enthalpy of sodium binding to the StOAD βγ sub-complex does not correlate with the buffer protonation enthalpy.

Figure 6—figure supplement 2.

(a)-(b) Plots of the ITC-measured enthalpy of sodium binding to the wild type (a) or E40A substituted (b) StOAD βγ sub-complex (ΔH) versus the buffer protonation enthalpy (ΔH(H+)). (c) A cluster of histidine residues at the periplasmic face of the StOAD β subunit. The histidine residues are highlighted with red labels.
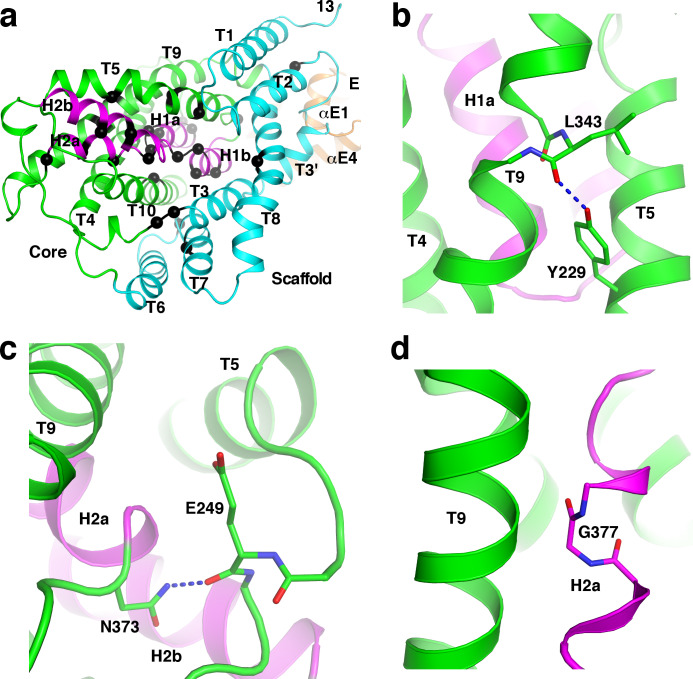
Figure 6—figure supplement 3. OAD β subunit residues characterized by previous mutagenesis studies.

Figure 6—figure supplement 3.

(a) OAD β subunit residues characterized by previous mutagenesis studies on KpOAD. They are mapped onto the structure of the StOAD β subunit and highlighted with black spheres. (b)-(d) Structural basis for the functional importance of Tyr229 (b), Asn373 (c) and Gly377 (d). They contribute to the stability of the core domain by interacting with neighboring residues.
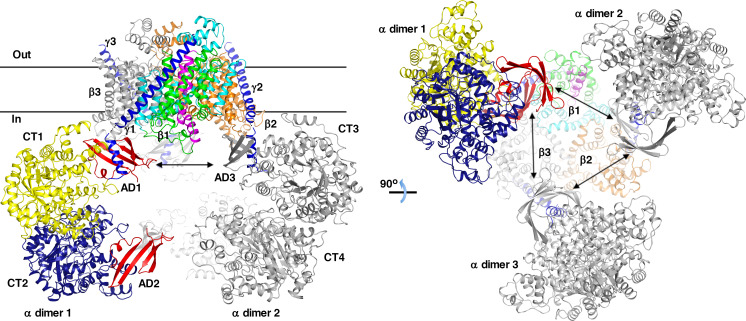
Figure 6—figure supplement 4. model of the OAD holoenzyme.

Figure 6—figure supplement 4.

The α subunit dimer is modeled based on the structure of pyruvate carboxylase (PDB 3BG5), whose CT and PT domains are homologous to the CT and AD domains in the α subunit. One of the AD domains in the α subunit dimer interacts with the γ subunit cytosolic tail. The BCCP domain is omitted due to its structural flexibility and small size. CT domains 1 and 2 in the α subunit dimer one are colored in yellow and blue, respectively; the AD domains are in red. α subunit dimers 2 and 3 are colored in gray. The arrows indicate potential interactions between the α subunit dimers. The black lines indicate boundaries of the membrane bilayer.