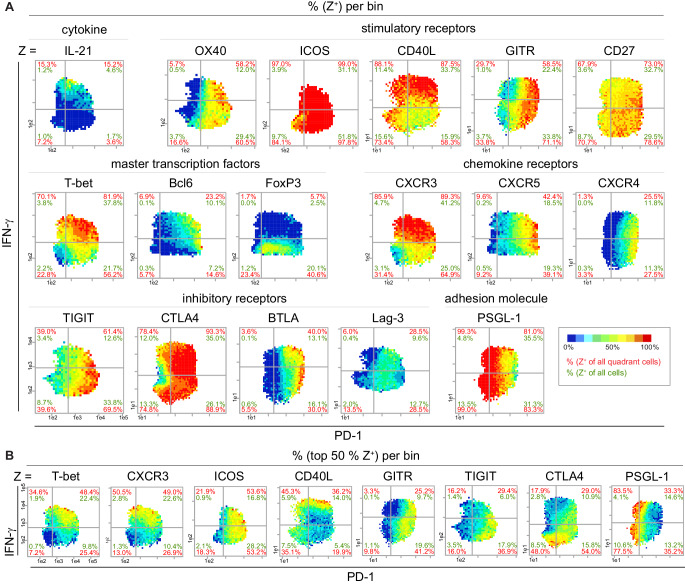
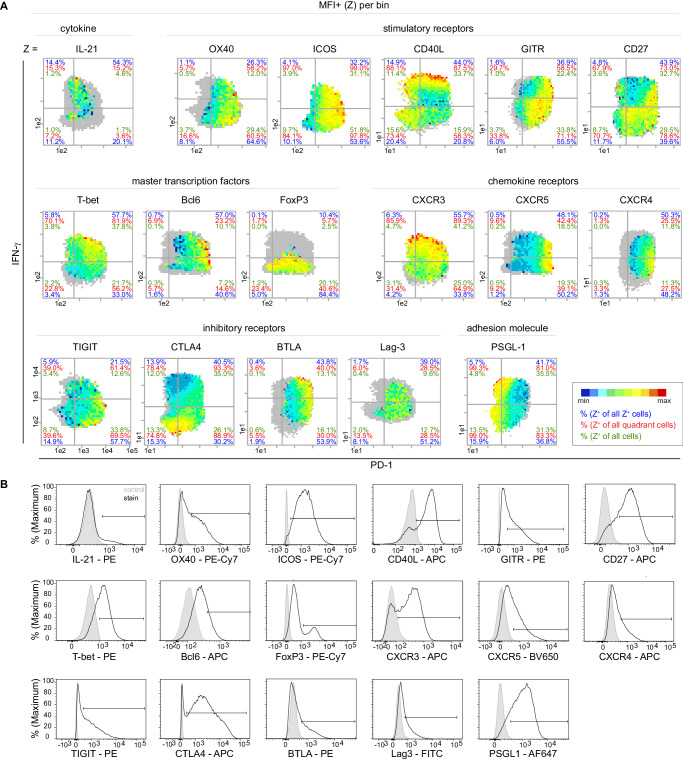
Figure 4. Super-functional T cells exhibit Th1 characteristics and are CD40Lhi ICOS+.
(A) Bin plots visualize the co-expression of PD-1 and IFN-γ with various proteins in stimulated (PMA/ionomycin) splenic T cells of old mice. (B) Distribution of the top 50% Z+ cells of selected markers from (A). If a bin contains the minimum number of cells (10), the frequency of the third marker is shown in pseudo-colors. Cell frequencies per quadrant are calculated on the number of Z+ cells in the quadrant (red) and number of Z+ cells per sample (green). Data are representative for at least two independent experiments with n ≥ 3 mice.


